Education
The information below includes preliminary data findings that will be updated throughout the Where We Live NYC process and do not represent the City of New York’s final findings or position on the information.
New York City’s public school system is by far the largest in the United States. During the 2017-2018 school year, more than 1.1 million students attended approximately 1,800 public schools administered by the New York City Department of Education (DOE) and various charter programs1. The first part of this page introduces the complicated relationship in New York City between racial and ethnic demographics, where students live, and where they attend school. The second part discusses disparate educational outcomes experienced by students across various characteristics protected by the federal Fair Housing Act, including race, ethnicity, disability status, and language proficiency.
Living Patterns and School Attendance by Race and Ethnicity
New York City is the most populous city in the United States, and—as discussed in more depth in HPD’s Preliminary Data Findings on Segregated and Integrated Living Patterns—its population of 8.4 million residents is unusually diverse. Nevertheless, there are distinct patterns of residential concentration by race and ethnicity across the city. While a mix of racial and ethnic groups live in some neighborhoods, each group predominates or is unevenly concentrated in many areas.
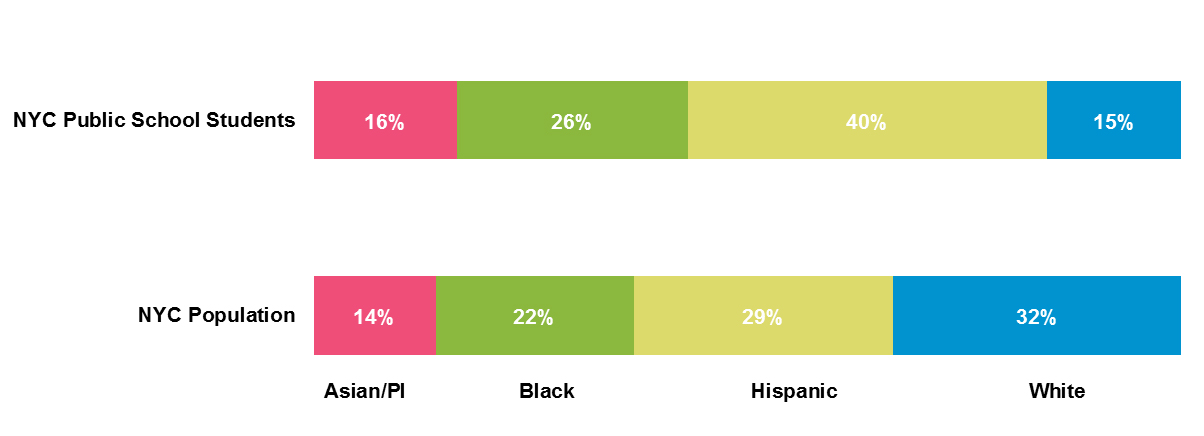
The diversity of students in public schools is similar to, but not the same as, the racial and ethnic demographics of all city residents. As the Composition of NYC Public School Students chart below shows, 40% of students identified as Hispanic, 26% as Black, 16% as Asian/Pacific Islander (PI), and 15% as White during the 2017-2018 school year2. These student numbers can be compared to the most recent data available regarding New York City’s overall population, which was 29% Hispanic, 22% Black, 14% Asian/PI, and 32% White, according to the 2012-2016 American Community Survey (ACS).
Composition of NYC Public School Students, 2017-20183
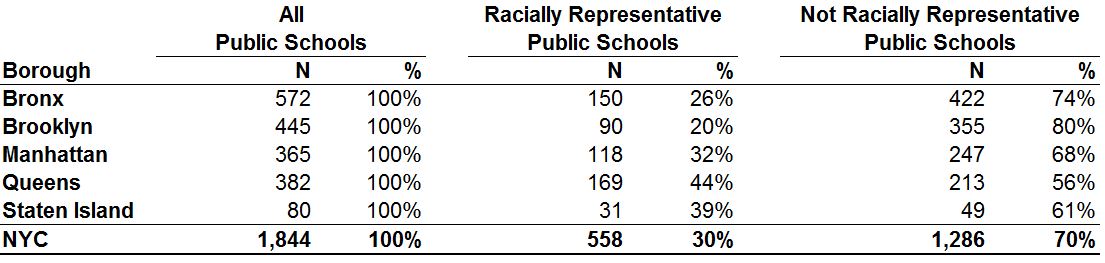
Approximately 30% of public schools in New York City are identified as “racially representative.” DOE measures whether the racial and ethnic demographics of a particular school are “racially representative” compared to its total student population. DOE defines a racially representative school as one that enrolls between 50 and 90 percent Black and Hispanic students. Currently, slightly fewer than one-third of all public schools meet this representativeness criteria, as shown on the Racially Representative Schools chart below. The statistics also vary by borough: 44 percent of schools in Queens are racially representative, while only 20 percent of schools in Brooklyn are racially representative.
Racially Representative Schools, 2017-20184
In New York City, segregated living patterns are one factor influencing racially unrepresentative schools, but they are not determinative. Historically, segregated living patterns have been cited as the reason for segregated schools5. However, recent national and local research suggests that the relationship between living patterns and school attendance is more complicated than previously assumed. For example, one recent study that analyzed national data from 1990 to 2015 found that 43.2% of school districts experienced a decrease in residential segregation and a simultaneous increase in school segregation6. In addition, there is evidence nationally that the perceived quality of schools and their associated enrollment policies strongly influence where families choose to live and adjacent housing prices7. In New York City, these latter findings are corroborated by multitudes of real estate articles that discuss DOE’s complex school enrollment policies and broker advertisements that highlight a residence’s proximity to certain schools8. Together, these studies and norms suggest that living patterns and school enrollment policies simultaneously influence each other.
DOE’s school enrollment policies create preferences for students who live proximally to certain schools, and also options for students to exercise geographic choice. DOE divides the city into 32 school districts and provides preferences in admissions to certain schools based on the location of a student’s residence. Elementary-school-aged students living in 29 of DOE’s 32 school districts are also assigned an elementary school zone, which creates various admissions priorities that are even more closely connected to the location of a student’s residence. Students living in zones or districts with high-performing schools may therefore benefit from admissions priority to schools with higher academic performance. DOE has a school choice policy, however, that allows students to access schools outside of their assigned elementary zones, districts, and even boroughs. School choice leads to a complex relationship between living patterns, school enrollment, and academic outcomes.
While almost all elementary students attend school in their assigned district, only 60% of kindergarteners attended school in their assigned zone within that district during the 2016-2017 school year. The Public School Students Who Attend School in Their Home District and Borough chart below shows the proportion of students who attended school in their district or borough in 2017. Approximately 98% of elementary-school-aged children attended school in their home borough, and 91% of students attended in their home district. However, a study recently published by the Center for New York City Affairs showed that only 60% of kindergartners attended their zoned elementary schools in the 2016-2017 school year, including only 40% of Black kindergartners9.
Public School Students Who Attend School in Their Home District and Borough, 2017-201810
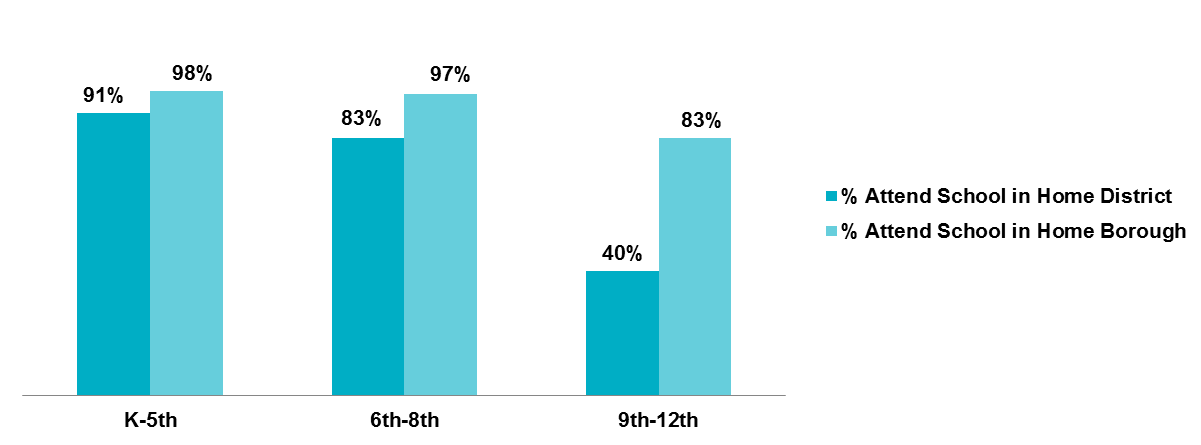
As students move to middle school and then on to high school, The Public School Students Who Attend School in Their Home District and Borough chart shows that the likelihood they will attend school in their home borough decreases slightly and the likelihood of staying in their home district decreases significantly. The percentage of students attending school in their home district was particularly high for students in kindergarten through 5th grade (91%), somewhat lower (83%) for 6th grade to 8th grade, and much lower (40%) for 9th to 12th grade.
Disparities in Academic Performance by Neighborhood and Protected Class11
The areas with the highest performing elementary schools, as measured by performance on state exams, are clustered in parts of Manhattan, Queens, Staten Island, and Downtown Brooklyn. The ELA Proficiency by School District map and the Math Proficiency by School District maps below show that 4th graders attending elementary school in certain areas, including northeast Queens, Upper and Midtown Manhattan, Downtown Brooklyn, south Brooklyn, and south Staten Island, demonstrate particularly high math and ELA proficiency rates compared to the citywide average. On the other hand, 4th graders attending elementary schools in the Bronx, central Brooklyn, and southeast Queens had lower scores on both the state ELA and math tests, with some areas having proficiency rates lower than 20%.
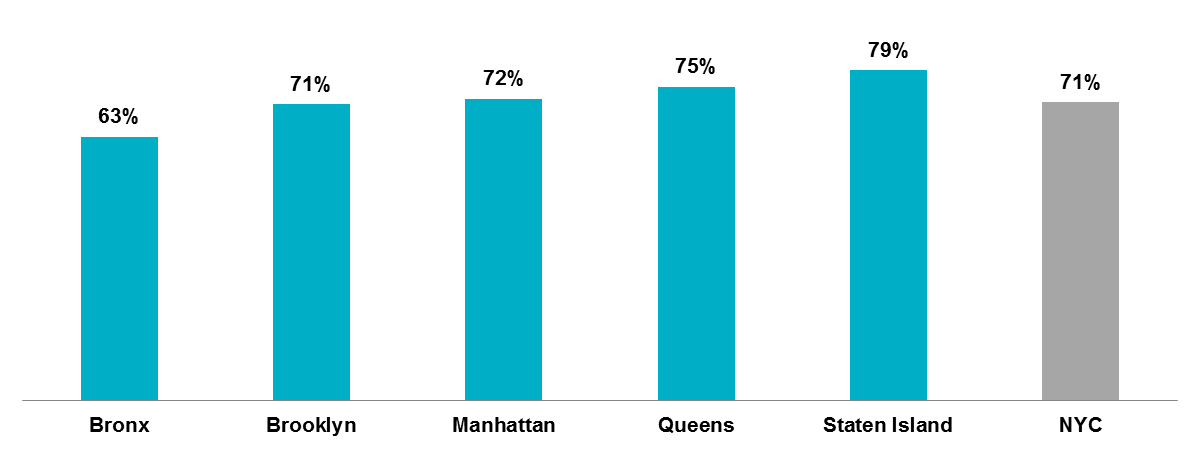
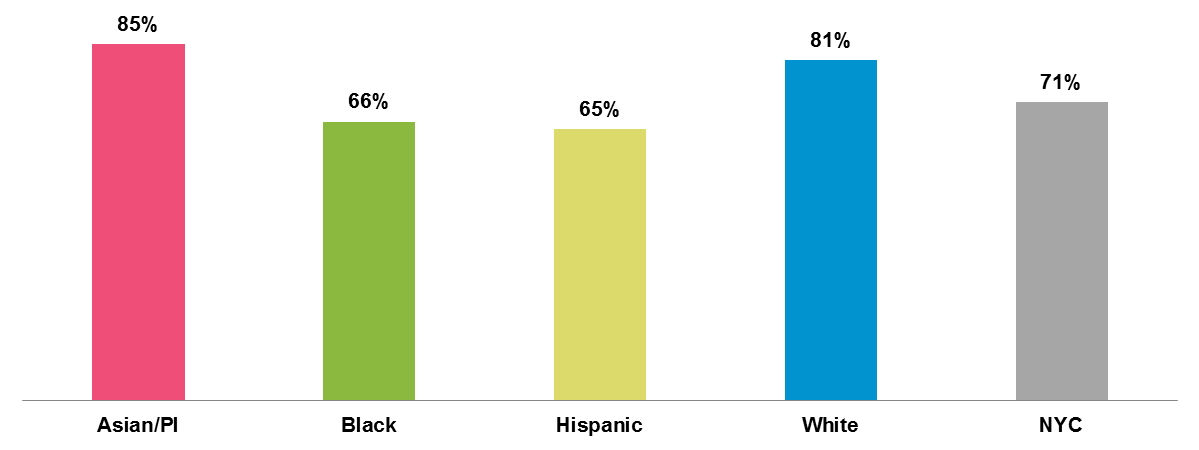
Graduation rates vary significantly by borough and by race and ethnicity. As shown in the Graduation Rate by Borough chart below, the citywide graduation rate among public school students who entered high school in 2013 and graduated in June 2017 was 71%. By borough, students who attended high school in Staten Island had the highest graduation rate (79%), followed by Queens (75%), Manhattan (72%), Brooklyn (71%) and the Bronx (63%). By race and ethnicity, as shown on the Graduation Rate by Race and Ethnicity chart below, Asian/PI students had the highest graduation rate (85%), followed by White (81%), Black (65%), and Hispanic (65%) students12.
Graduation Rate by Borough, 201713
Graduation Rate by Race and Ethnicity, 201714
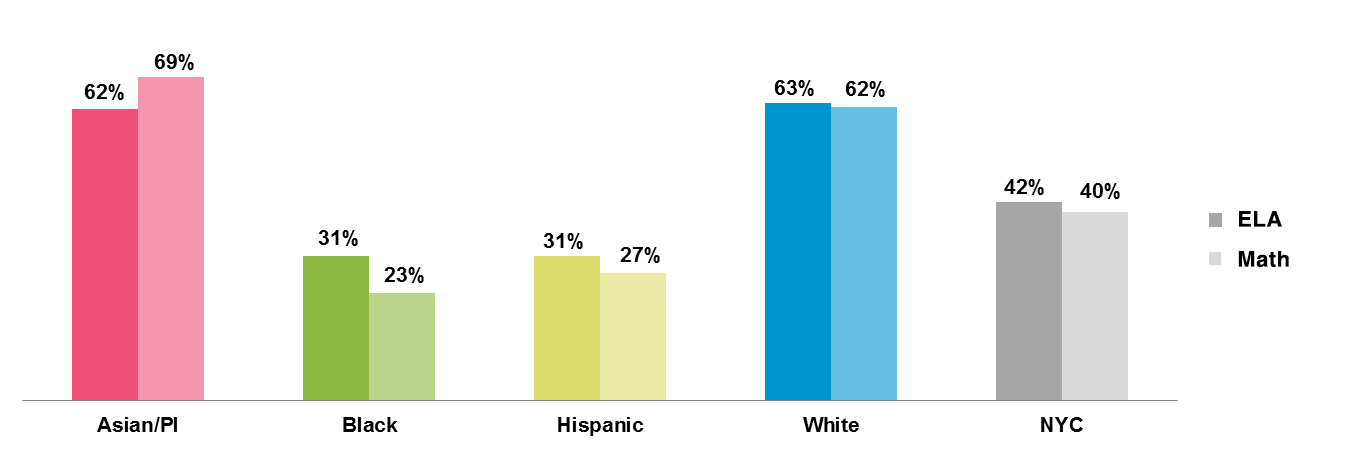
Academic performance based on state testing varies by race and ethnicity. The Math and ELA Proficiency by Race and Ethnicity chart below shows the proportion of the total 4th grade test takers of each racial group that scored “proficient” or above on the state English Language Arts (ELA) and math tests in 201715. This brief uses 4th grade test scores to align with the measurement of school proficiency issued by the U.S. Department of Housing and Urban Development (HUD). However, this is just one limited measure16. In 2017, approximately 42% of students citywide scored proficient on the state ELA test, and 40% scored proficient on the state math test. In ELA, White 4th graders had the highest rates of proficiency (63%), followed by Asian/PI (62%), Black (31%), and Hispanic (31%) 4th graders. In math, Asian/PI 4th graders had the highest proficiency rates (69%), followed by White (62%), Hispanic (27%) and Black (23%) 4th graders.
Math and ELA Proficiency by Race and Ethnicity, 201717
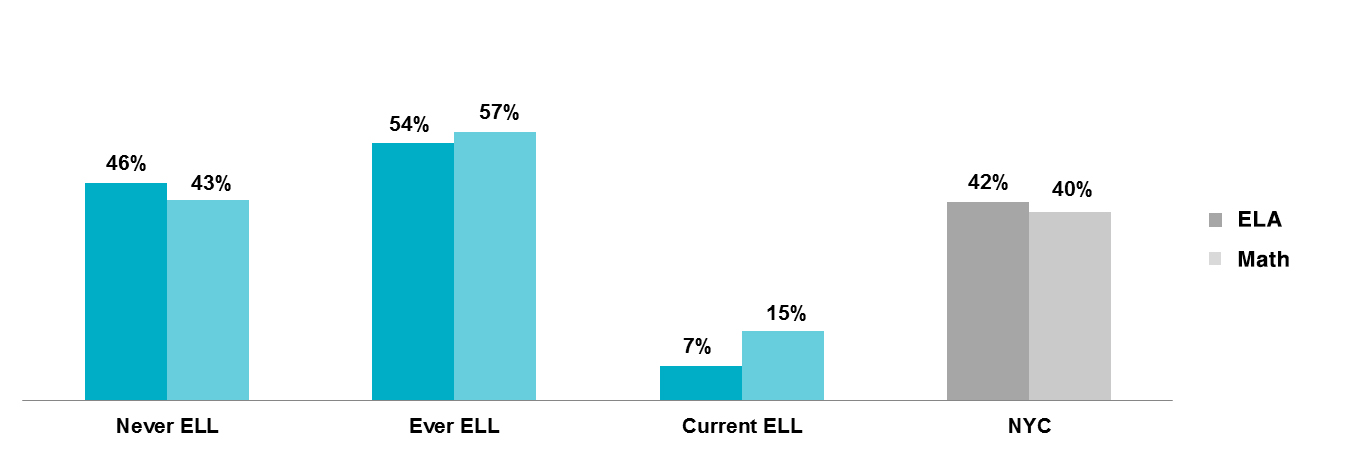
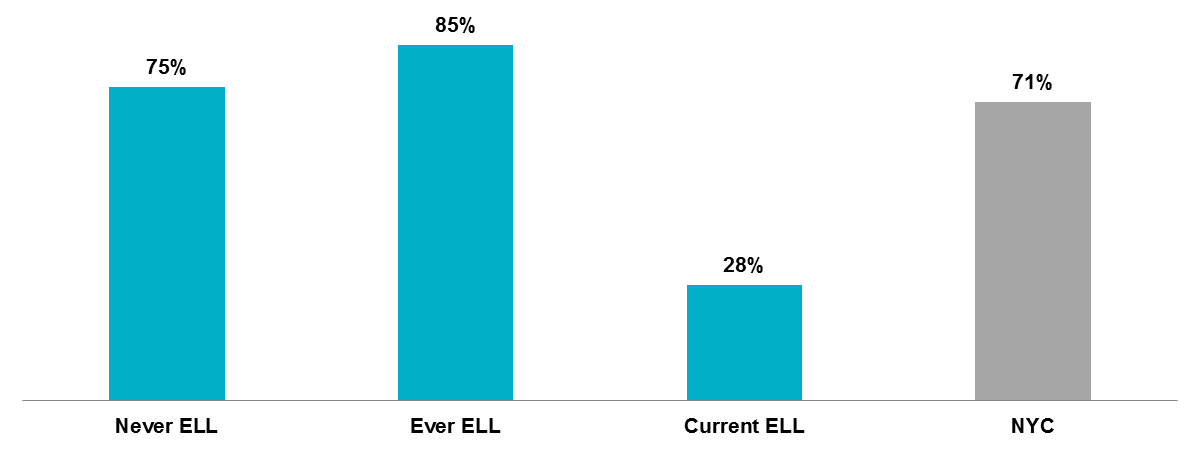
Academic performance varies by students’ English proficiency. Almost 14% of public school students were enrolled in English Language Learner (ELL)18 programs and services in the 2017-2018 school year. Only 7% of current ELL students (“Current ELLs”) scored proficient or above on the state ELA exam and 15% scored proficient or above on the math exam, as shown from the Math and ELA Proficiency by English Language Learner Status19 chart below. However, having enrolled in ELL services in the past is not associated with lower test scores. Of the ELL students who were enrolled in ELL programs at any time (“Ever ELLs”), 54% scored proficient in ELA and 57% in math, compared to 46% proficient in ELA and 43% in math for students who were never enrolled in ELL programs (“Never ELLs”). The High School Graduation Rate by English Language Learner Status chart below also shows that Ever ELLs had the highest high school graduation rate of 85% in 2017, compared to the rate of 75% of Never ELLs and 28% of Current ELLs.
Math and ELA Proficiency by English Language Learner Status, 201720
High School Graduation Rate by English Language Learner Status, 201721
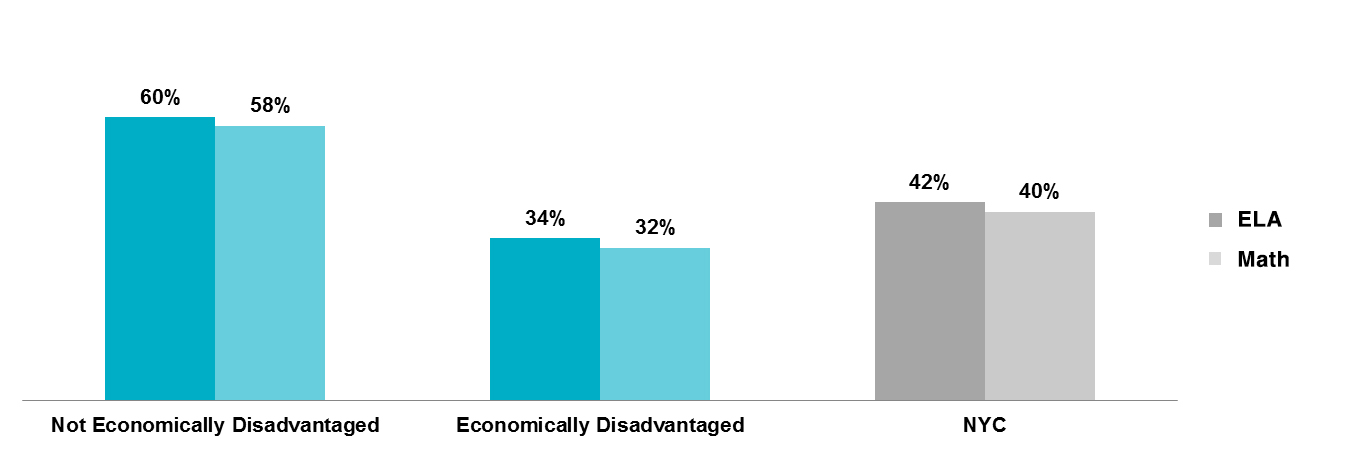
Economic condition is associated with academic performance22. About 70% of public school students were “economically disadvantaged” in 2017, which DOE defines as students eligible for assistance from the NYC Human Resources Administration (HRA) or living in temporary housing or in census tracts with above-average poverty levels. As shown on the Math and ELA Proficiency by Economic Status chart below, 34% of economically disadvantaged students were considered proficient in ELA, compared to 60% of those who were not disadvantaged. On the math exam, 32% of economically disadvantaged students were proficient, compared to 58% proficient for those who were not disadvantaged.
Math and ELA Proficiency by Economic Status, 201723
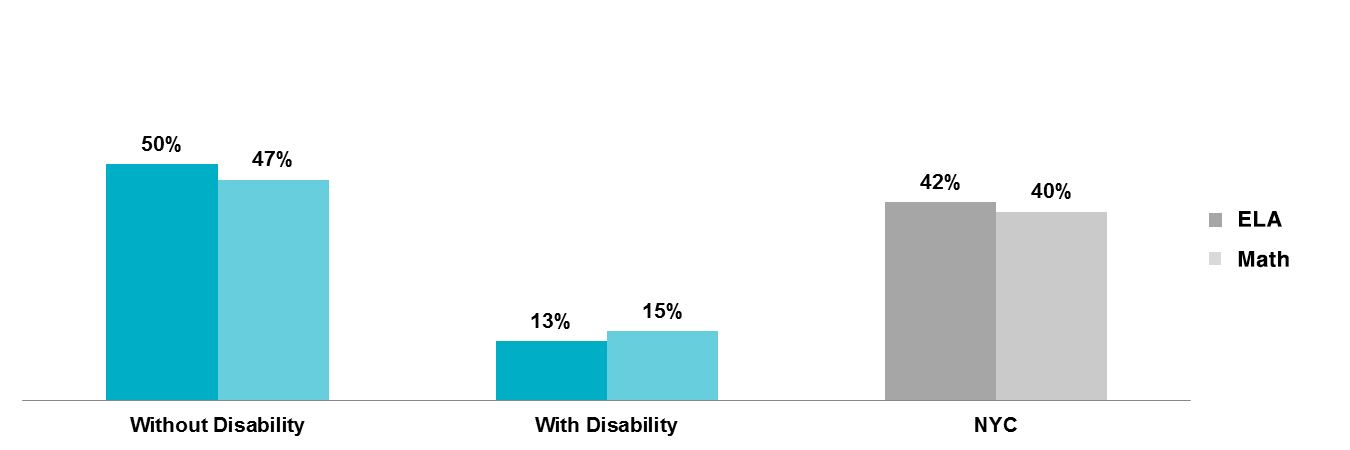
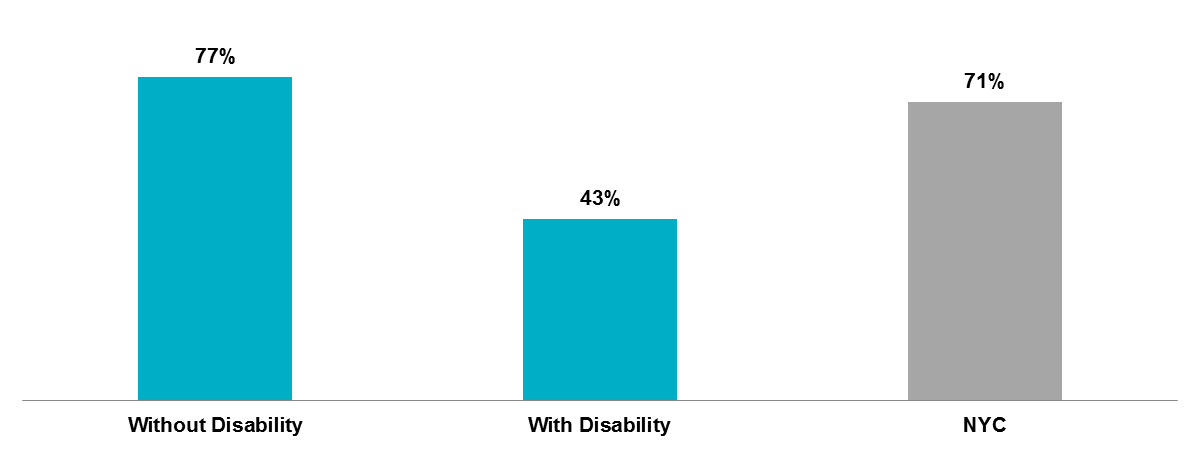
Academic performance varies by a student’s disability status. Almost 20% of public school students in 2017-2018 were living with a disability, as identified by DOE’s Committee on Special Education, and receive services under the federal Individuals with Disabilities Education Act (IDEA)24. As shown on the Math and ELA Proficiency by Disability Status chart below, 13% of students with a disability scored proficient on the state ELA exam, compared to 50% of students without a disability. For the math exam, 15% of students with a disability scored proficient, compared to 47% of students without a disability. With regard to high school graduation, the High School Graduation Rate by Disability Status chart below shows that 43% of students with a disability graduated within four years in 2017, compared to 77% of students without a disability.
Math and ELA Proficiency by Disability Status, 201725
High School Graduation Rate by Disability Status, 201726
- NYC Department of Education, “2013 – 2018 Demographic Snapshot,” from:
https://infohub.nyced.org/reports-and-policies/citywide-information-and-data/information-and-data-overview. - Unless otherwise specified, Asian/PI, Black, and White populations are considered non-Hispanic. Because the U.S. Census Bureau uses the term “Hispanic” in its population figures, the City will also use the term with regard to its population analyses. The City will use the term “Latinx” when relevant. Each of these categories also encompasses significant diversity and a range of national origins, which vary across the city’s neighborhoods. This diversity will be explored in the final report.
- Sources: New York City Department of Education “2013 – 2018 Demographic Snapshot.” Limited to school year 2017-2018. All races are mutually exclusive. Hispanic includes all races. Not shown: 2.5% other or N/A. Total Enrollment PK-12: 1.1 million students in 1800+ schools. Both district and charter schools are included. HPD calculations based on ACS 2012-2016, 5-year estimates, Table B03002 for NYC population statistics.
- Sources: New York City Department of Education “2013 – 2018 Demographic Snapshot.” Limited to school year 2017-2018. Both district and charter schools are included. DOE defines a school as “racially representative” if Black and Latino students combined make up at least 50 percent of the student population, but no more than 90 percent of the student population.
- Coughlan, R. (2018). Divergent Trends in Neighborhood and School Segregation in the Age of School Choice. Peabody Journal of Education, retrieved November 21, 2018, from: https://doi.org/10.1080/0161956X.2018.1488385.
- Coughlan, R. (2018). See note 3.
- Owens, A. (2017). Racial Residential Segregation of School-Age Children and Adults: The Role of Schooling as a Segregating Force. Russell Sage Foundation Journal of the Social Sciences, 3(2), 67; Owens, A. (2016). Inequality in Children’s Contexts: Income Segregation of Households With and Without Children. American Sociological Review, 81(3), 549-574.
- Blatter, L. et al. (2018). The Buyer’s and Renter’s Guide to the NYC Elementary School Game. Brick Underground, retrieved November 21, 2018, from: https://www.brickunderground.com/blog/2013/03/buyers_and_renters_guide_to_NYC_grade_schools.
- Mader, Nicole et al. (2018). “The Paradox of Choice: How School Choice Divides New York City Elementary Schools,” retrieved November 5, 2018, from: http://www.centernyc.org/the-paradox-of-choice/.
- Sources: New York City Department of Education, 2017-18 Audited Register. Charter schools are not included.
- The data cited in this section of the brief does not include charter schools.
- NYC Department of Education, “Graduation Results for Cohorts 2001 to 2013 (Classes of 2005 to 2017),” from: https://infohub.nyced.org/reports-and-policies/citywide-information-and-data/graduation-results.
- Sources: New York City Department of Education, Graduation Results Class 2005-2017. Graduation results reported here are limited to the student body of 2013 total cohort, 4-year June, however DOE primarily relies on 4-year August graduation rates. This data will be updated to reflect 4-year August rates in the final report. Graduation rate is defined as the percentage of students who entered 9th grade in 2013 and earned either a local or Regent’s diploma by June 2017. Charter schools are not included.
- Sources: New York City Department of Education, Graduation Results Class 2005-2017. Graduation results reported here are limited to the student body of 2013 total cohort, 4-year June, however DOE primarily relies on 4-year August graduation rates. This data will be updated to reflect 4-year August rates in the final report. Graduation rate is defined as the percentage of students who entered 9th grade in 2013 and earned either a local or Regent’s diploma by June 2017. Charter schools are not included.
- NYC Department of Education, “2017 English Language Arts and Math Results Summary,” from: https://infohub.nyced.org/reports-and-policies/citywide-information-and-data/test-results.
- DOE uses many additional measures to identify school quality, which it collectively describes as the Framework for Great Schools. NYC Department of Education, “The Framework for Great Schools,” from: https://www.schools.nyc.gov/about-us/vision-and-mission/framework-for-great-schools.
- Sources: New York City Department of Education, 2017 English Language Arts and math test results summary. This data will be updated to reflect 2018 test results in the final report. Proficiency for their grade is defined as Level 3, and Above Proficient is defined as Level 4. Charter schools are not included.
- English Language Learners (ELL) are students who DOE identifies as speaking another language at home and who need additional support programs and services learning English. While ELL status is not a protected class under the Fair Housing Act, it is closely related to national origin, which is a protected class.
- Current ELLs are those identified as an ELL during the reported year. Ever ELLs are those identified as an ELL any year prior to the reported year but not during the reported year. Never ELLs are those never reported to have received ELL services.
- Sources: New York City Department of Education, 2017 English Language Arts and math test results summary. This data will be updated to reflect 2018 test results in the final report. Proficiency for their grade is defined as Level 3, and Above Proficient is defined as Level 4. Charter schools are not included.
- Sources: New York City Department of Education, Graduation Results Class 2005-2017. Graduation results reported here are limited to the student body of 2013 total cohort, 4-year June, however DOE primarily relies on 4-year August graduation rates. This data will be updated to reflect 4-year August rates in the final report. Graduation rate is defined as the percentage of students who entered 9th grade in 2013 and earned either a local or Regent’s diploma by June 2017. Charter schools are not included.
- Socioeconomic status is not a protected class under the federal Fair Housing Act, but it is an important factor to include in this brief because it strongly correlates with other protected classes and academic performance.
- Sources: NYC Department of Education, 2017 English Language Arts and math test results summary. This data will be updated to reflect 2018 test results in the final report. Proficiency for their grade is defined as Level 3, and Above Proficient is defined as Level 4. Charter schools are not included.
- Students with disabilities include those having an intellectual disability; hearing impairment, including deafness; speech or language impairment; visual impairment, including blindness; serious emotional disturbance; orthopedic impairment; autism; traumatic brain injury; developmental delay; other health impairment; specific learning disability; deaf-blindness; or multiple disabilities and who, by reason thereof, receive special education and related services.
- Sources: New York City Department of Education, 2017 English Language Arts and math test results summary. This data will be updated to reflect 2018 test results in the final report. Proficiency for their grade is defined as Level 3, and Above Proficient is defined as Level 4. Charter schools are not included.
- Sources: New York City Department of Education, Graduation Results Class 2005-2017. Graduation results reported here are limited to the student body of 2013 total cohort, 4-year June, however DOE primarily relies on 4-year August graduation rates. This data will be updated to reflect 4-year August rates in the final report. Graduation rate is defined as the percentage of students who entered 9th grade in 2013 and earned either a local or Regent’s diploma by June 2017. Charter schools are not included.