Learn about the six fair housing goals
The six goals are Where We Live NYC’s foundation. Learn more about what each of the goals are about and review a selection of maps and charts that define the issues. The 2025 draft plan includes housing, demographic, and neighborhood data in over 100 charts and maps. The full set is available in draft plan appendix.
Goal 1 Goal 2 Goal 3 Goal 4 Goal 5 Goal 6
GOAL 1
Fight housing discrimination and ensure equal access to housing
Discrimination against New Yorkers looking to rent, buy, or get a loan for a home is still a widespread practice that unfairly limits housing and neighborhood options for many.
Ending discrimination in its different forms is not easy. That’s why the City is taking a multi-faceted approach through increased enforcement and protections to address the complex and persistent discrimination that still occurs in the housing market.
NYC Population by Race and Ethnicity, 2019-2023*
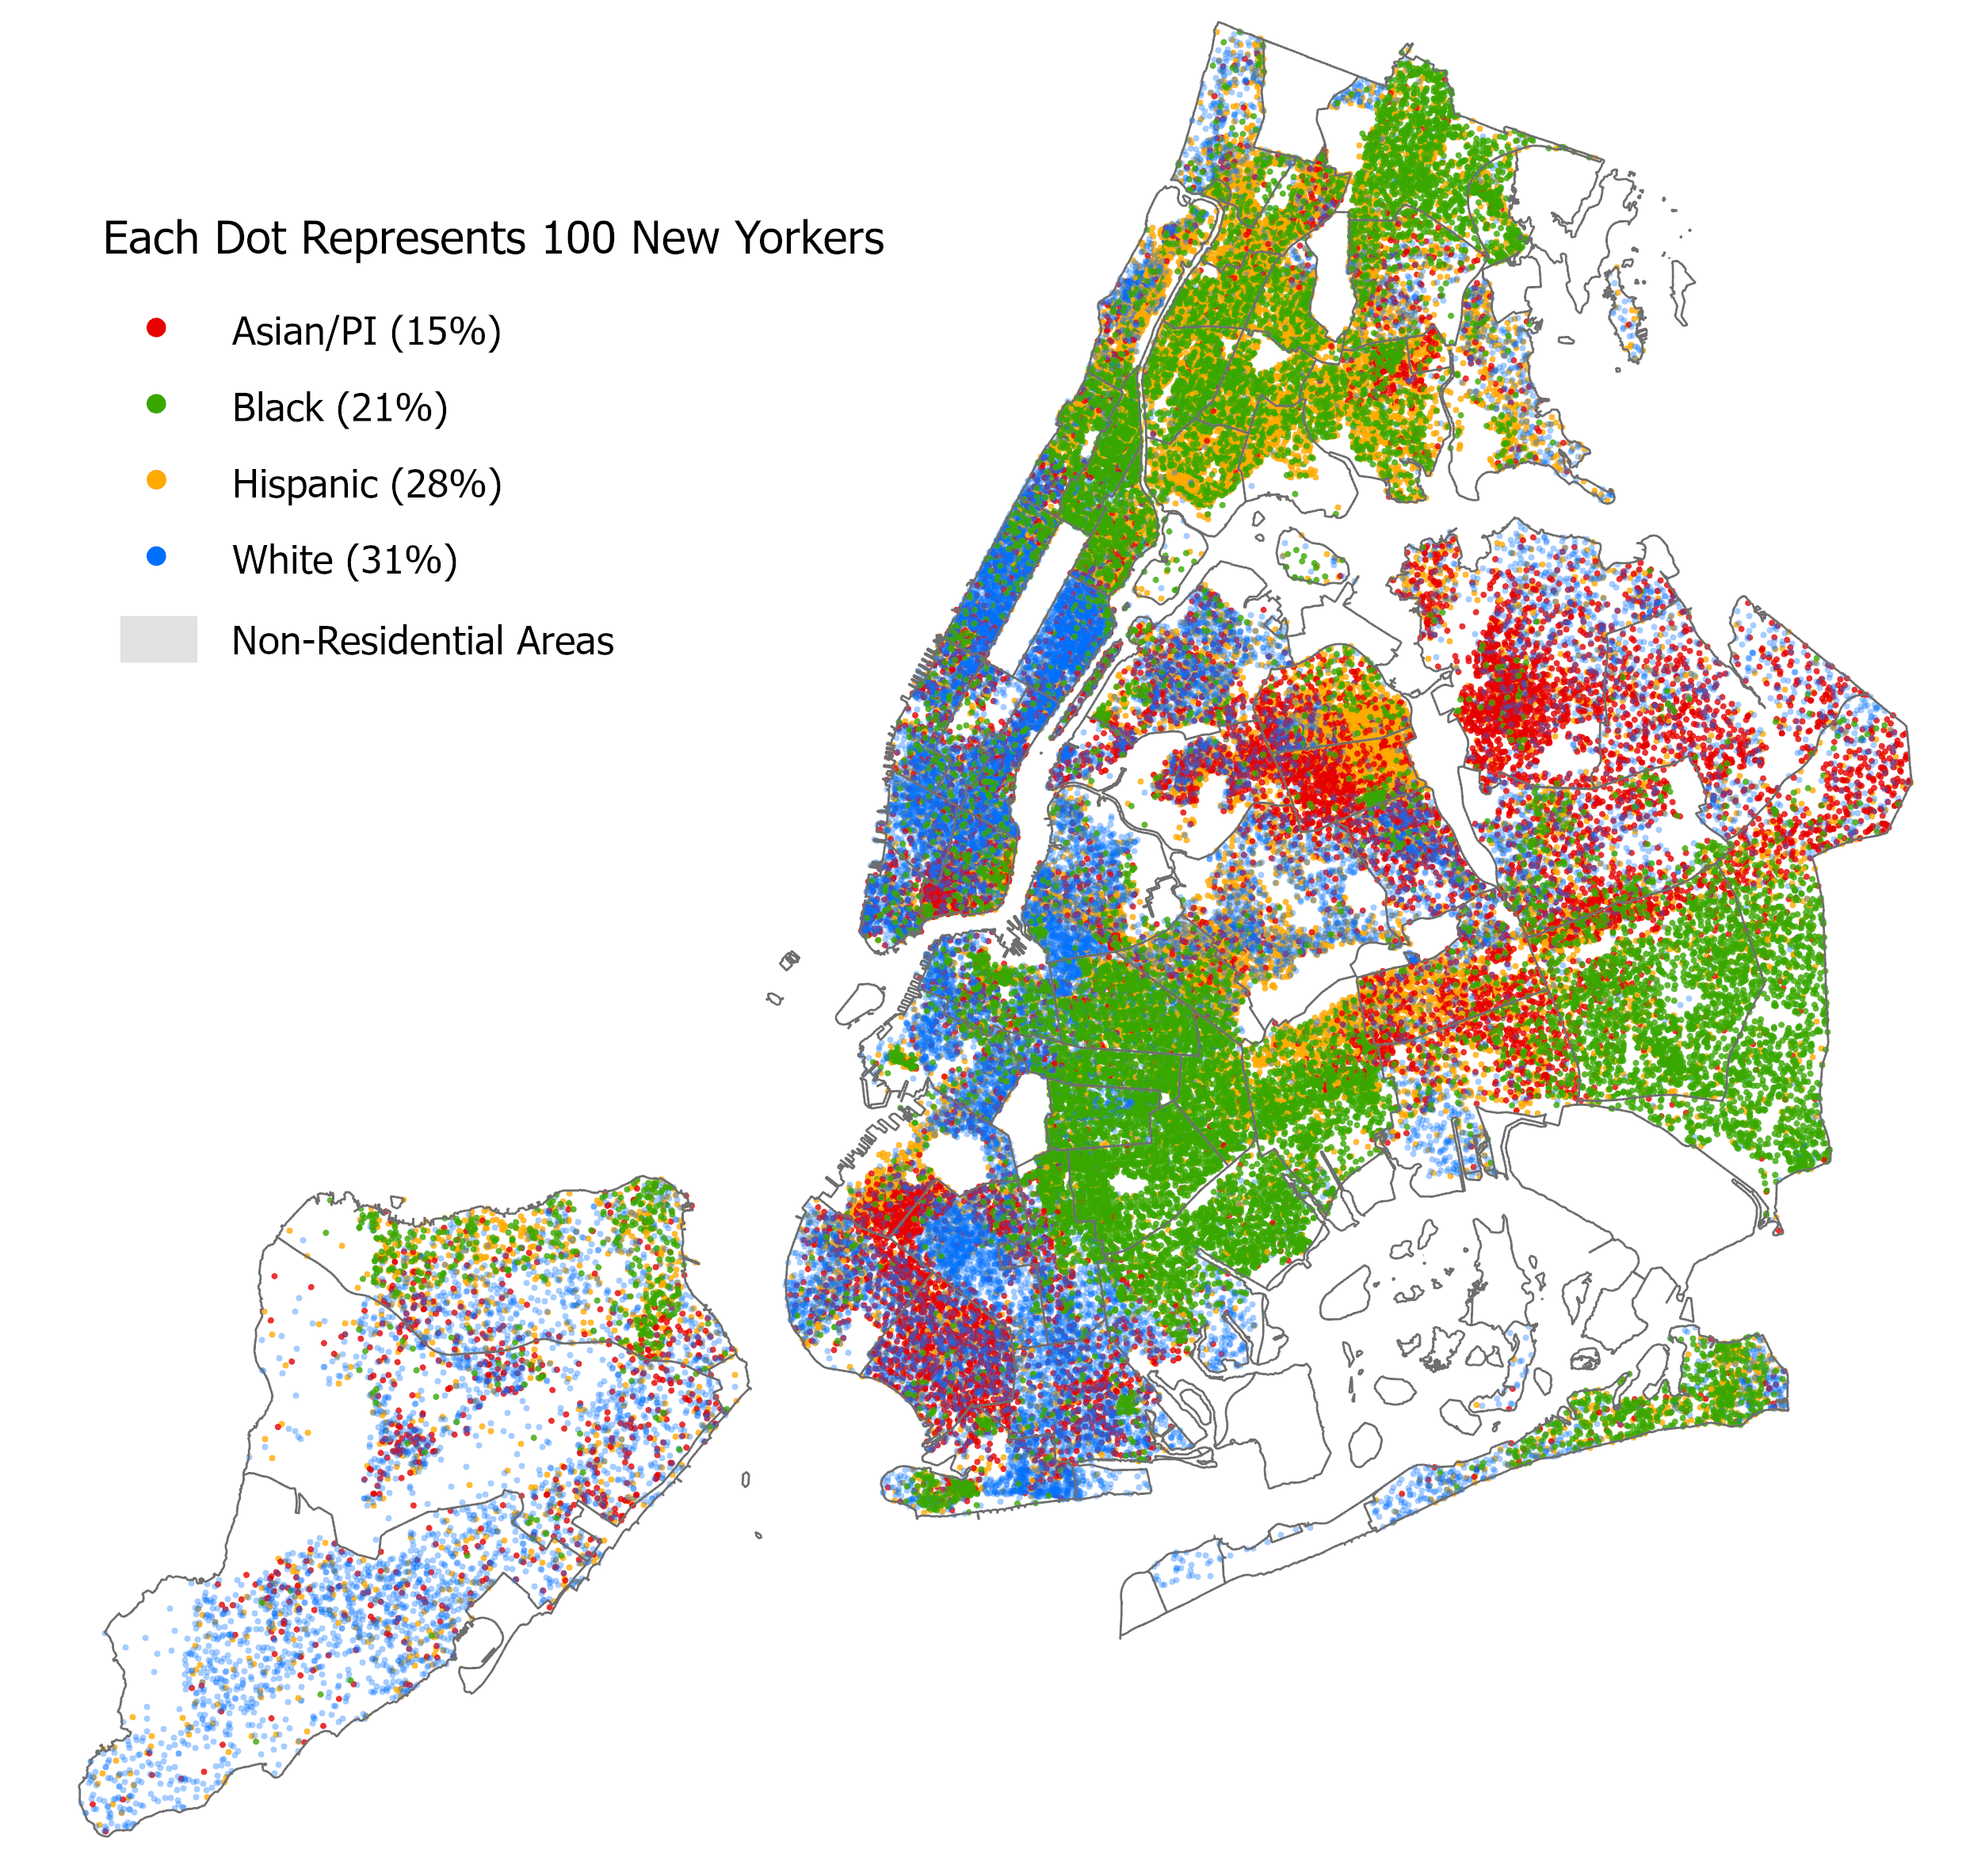
As of the 2019-2023 ACS, New York City’s 8.5 million residents were 31% White, 28% Hispanic, 21% Black, and 15% Asian/PI. This figure shows a representation of how members of those racial and ethnic groups are distributed across the city. Each dot represents 100 New Yorkers.
Rental Vacancy Rate by Asking Rent, 2023

According to the 2023 NYCHVS, the citywide net rental vacancy rate was 1.4%, one of the lowest rates since the NYCHVS began in 1965. This figure shows that the net vacancy rate was especially low for lower-cost rental units, with just 0.4% of units renting for under $1,100 — representing the bottom quartile of 2023 rents — reported as vacant. Only units with asking rents above $2,400 — the top quartile — had a vacancy rate over 1%, reporting a net rental vacancy rate of 3.4%.
GOAL 2
Build more housing in all neighborhoods, across New York City and the region
New York City has a housing crisis. There is a growing population and rising demand for homes, but a limited supply. This makes it especially challenging for low-income New Yorkers, who are disproportionately people of color and people with disabilities, to find housing options that are affordable.
To affirmatively further fair housing, the City must ensure that residents have realistic options to live in a variety of thriving neighborhoods. This requires expanding housing options for low-income residents across New York City and the region.
Housing Units in New Buildings Completed Between 2014-2024
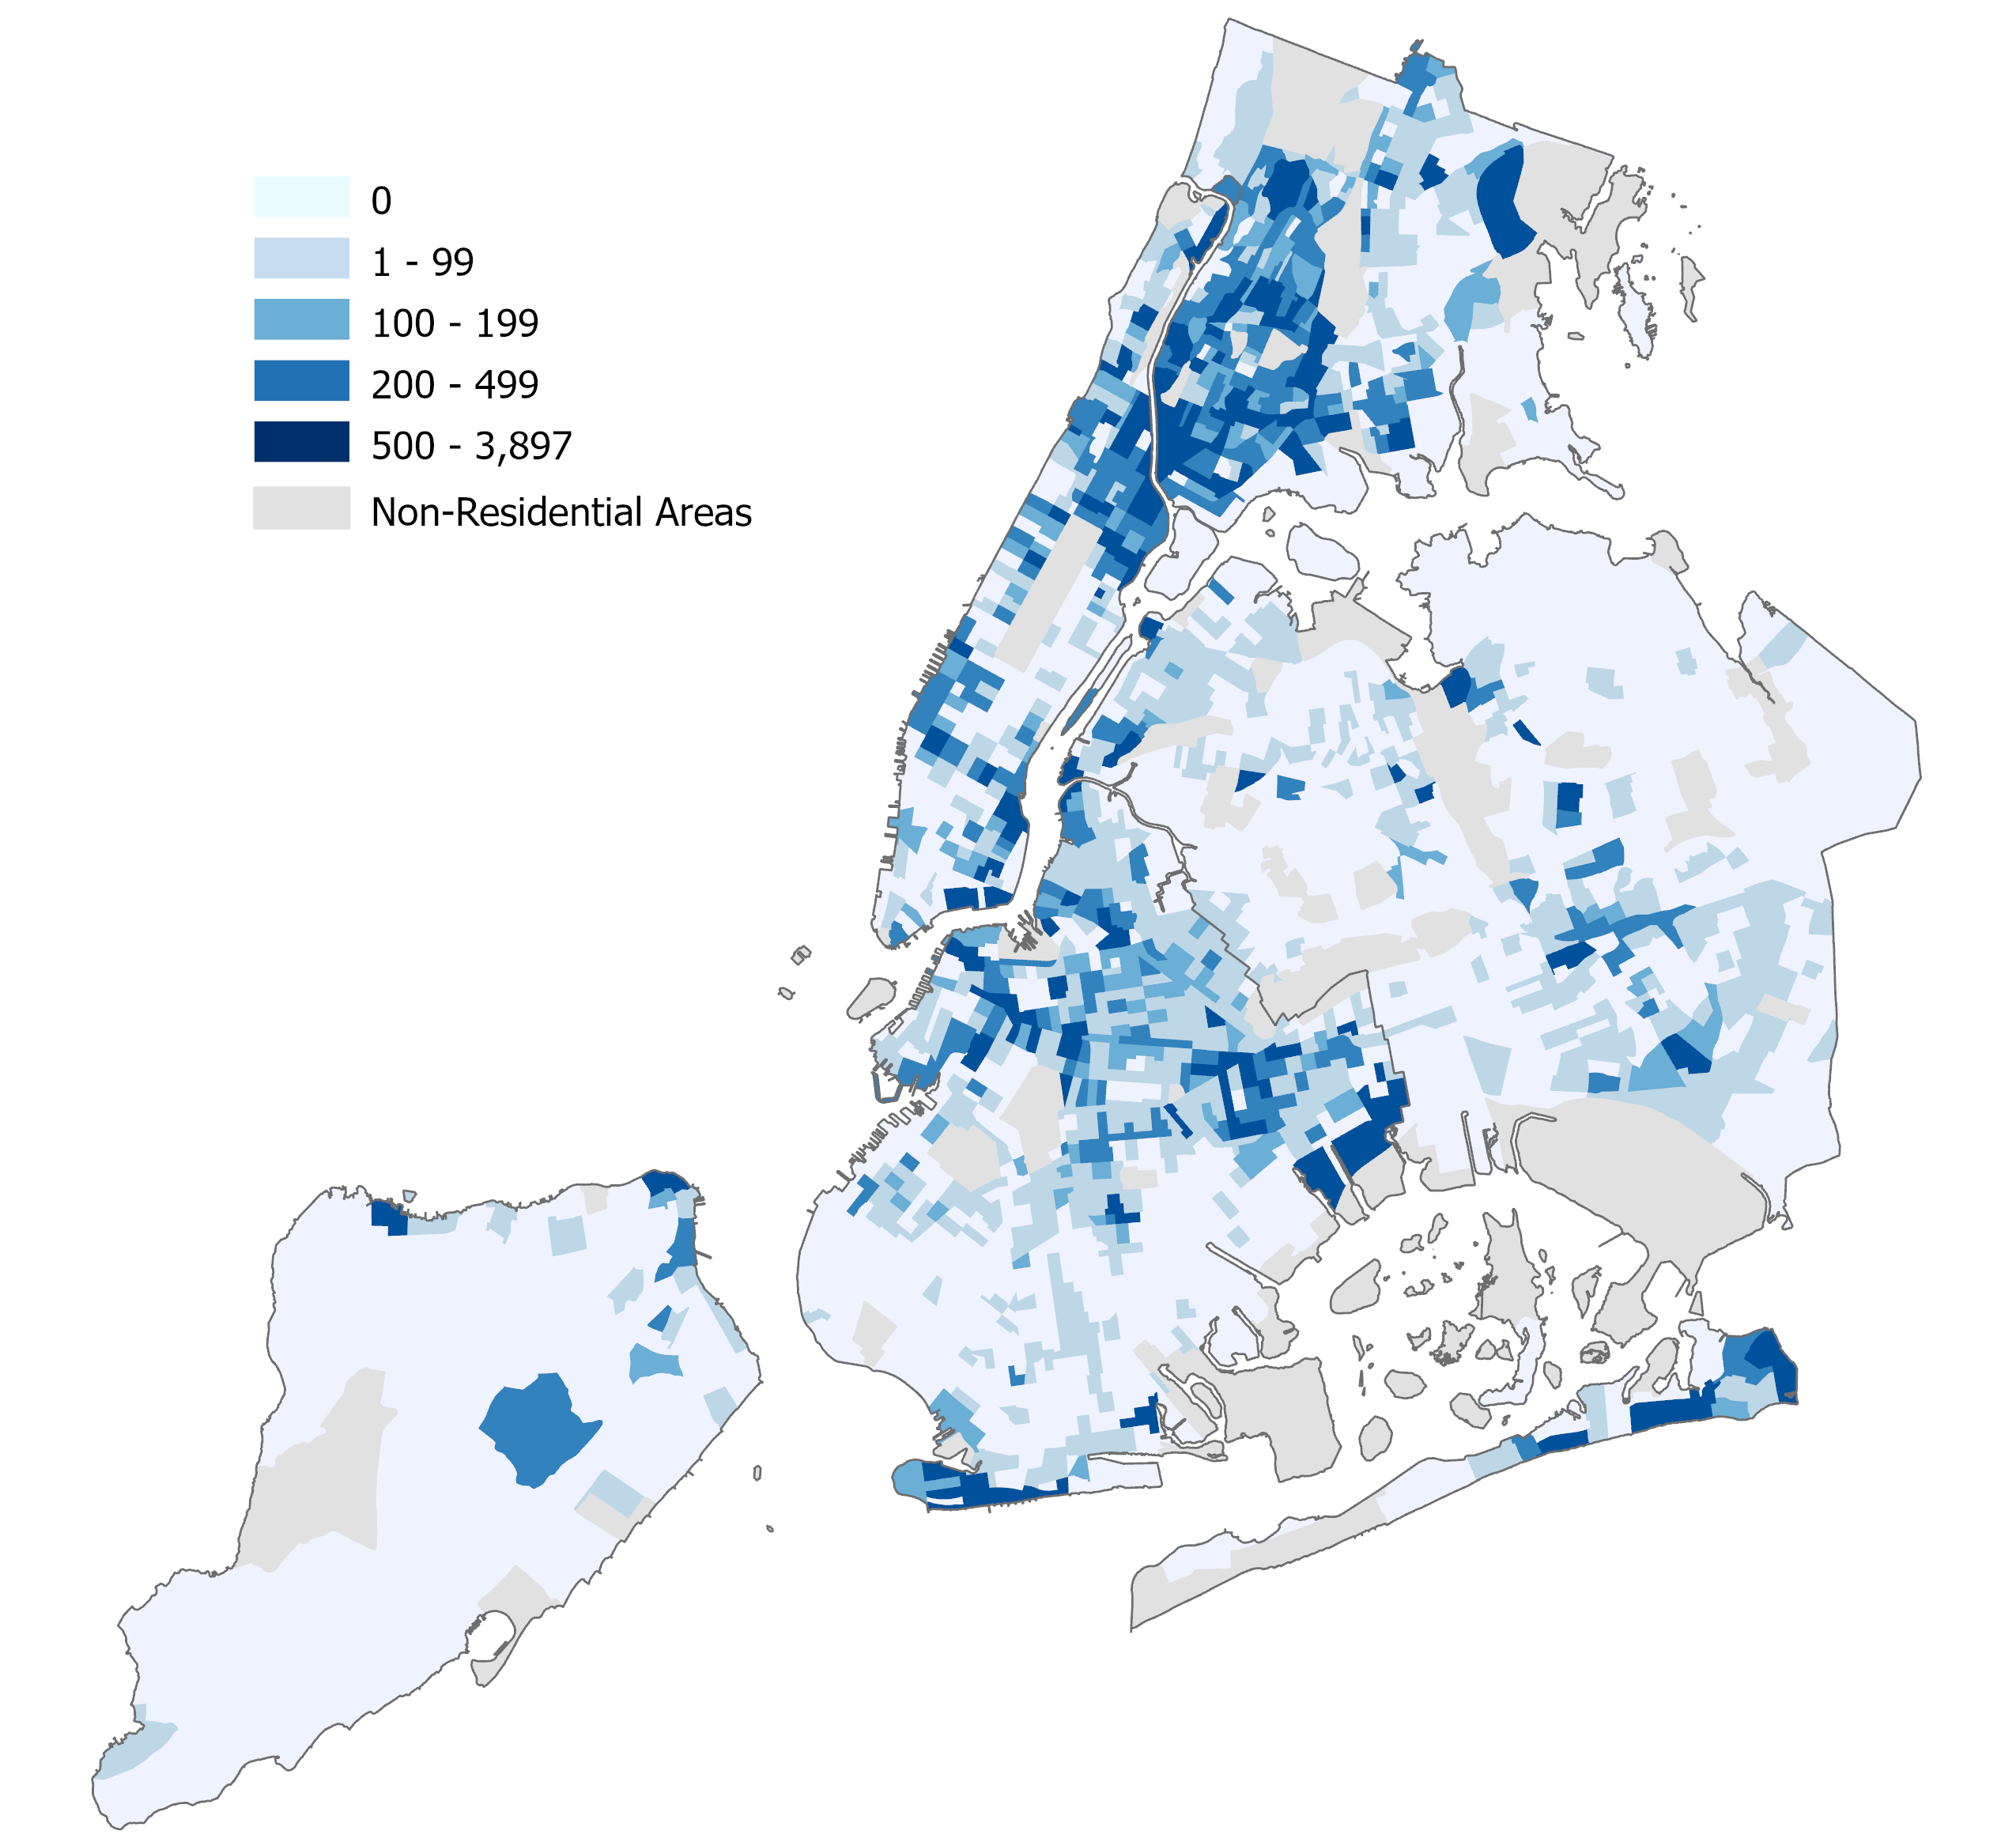
This figure aggregates the number of new housing units added to each Neighborhood Tabulation Area (NTA) in new buildings completed between 2014 and 2024. More than 265,000 units were completed during this period, but these units were heavily concentrated in certain neighborhoods. Of the 198 NTAs citywide with a new building completed during this time period, the top ten contributed 30% of new units, while the bottom half (99) of these NTAs accounted for just 10% of total production.
Limited Affordability Areas (LAAs) 2023-Present
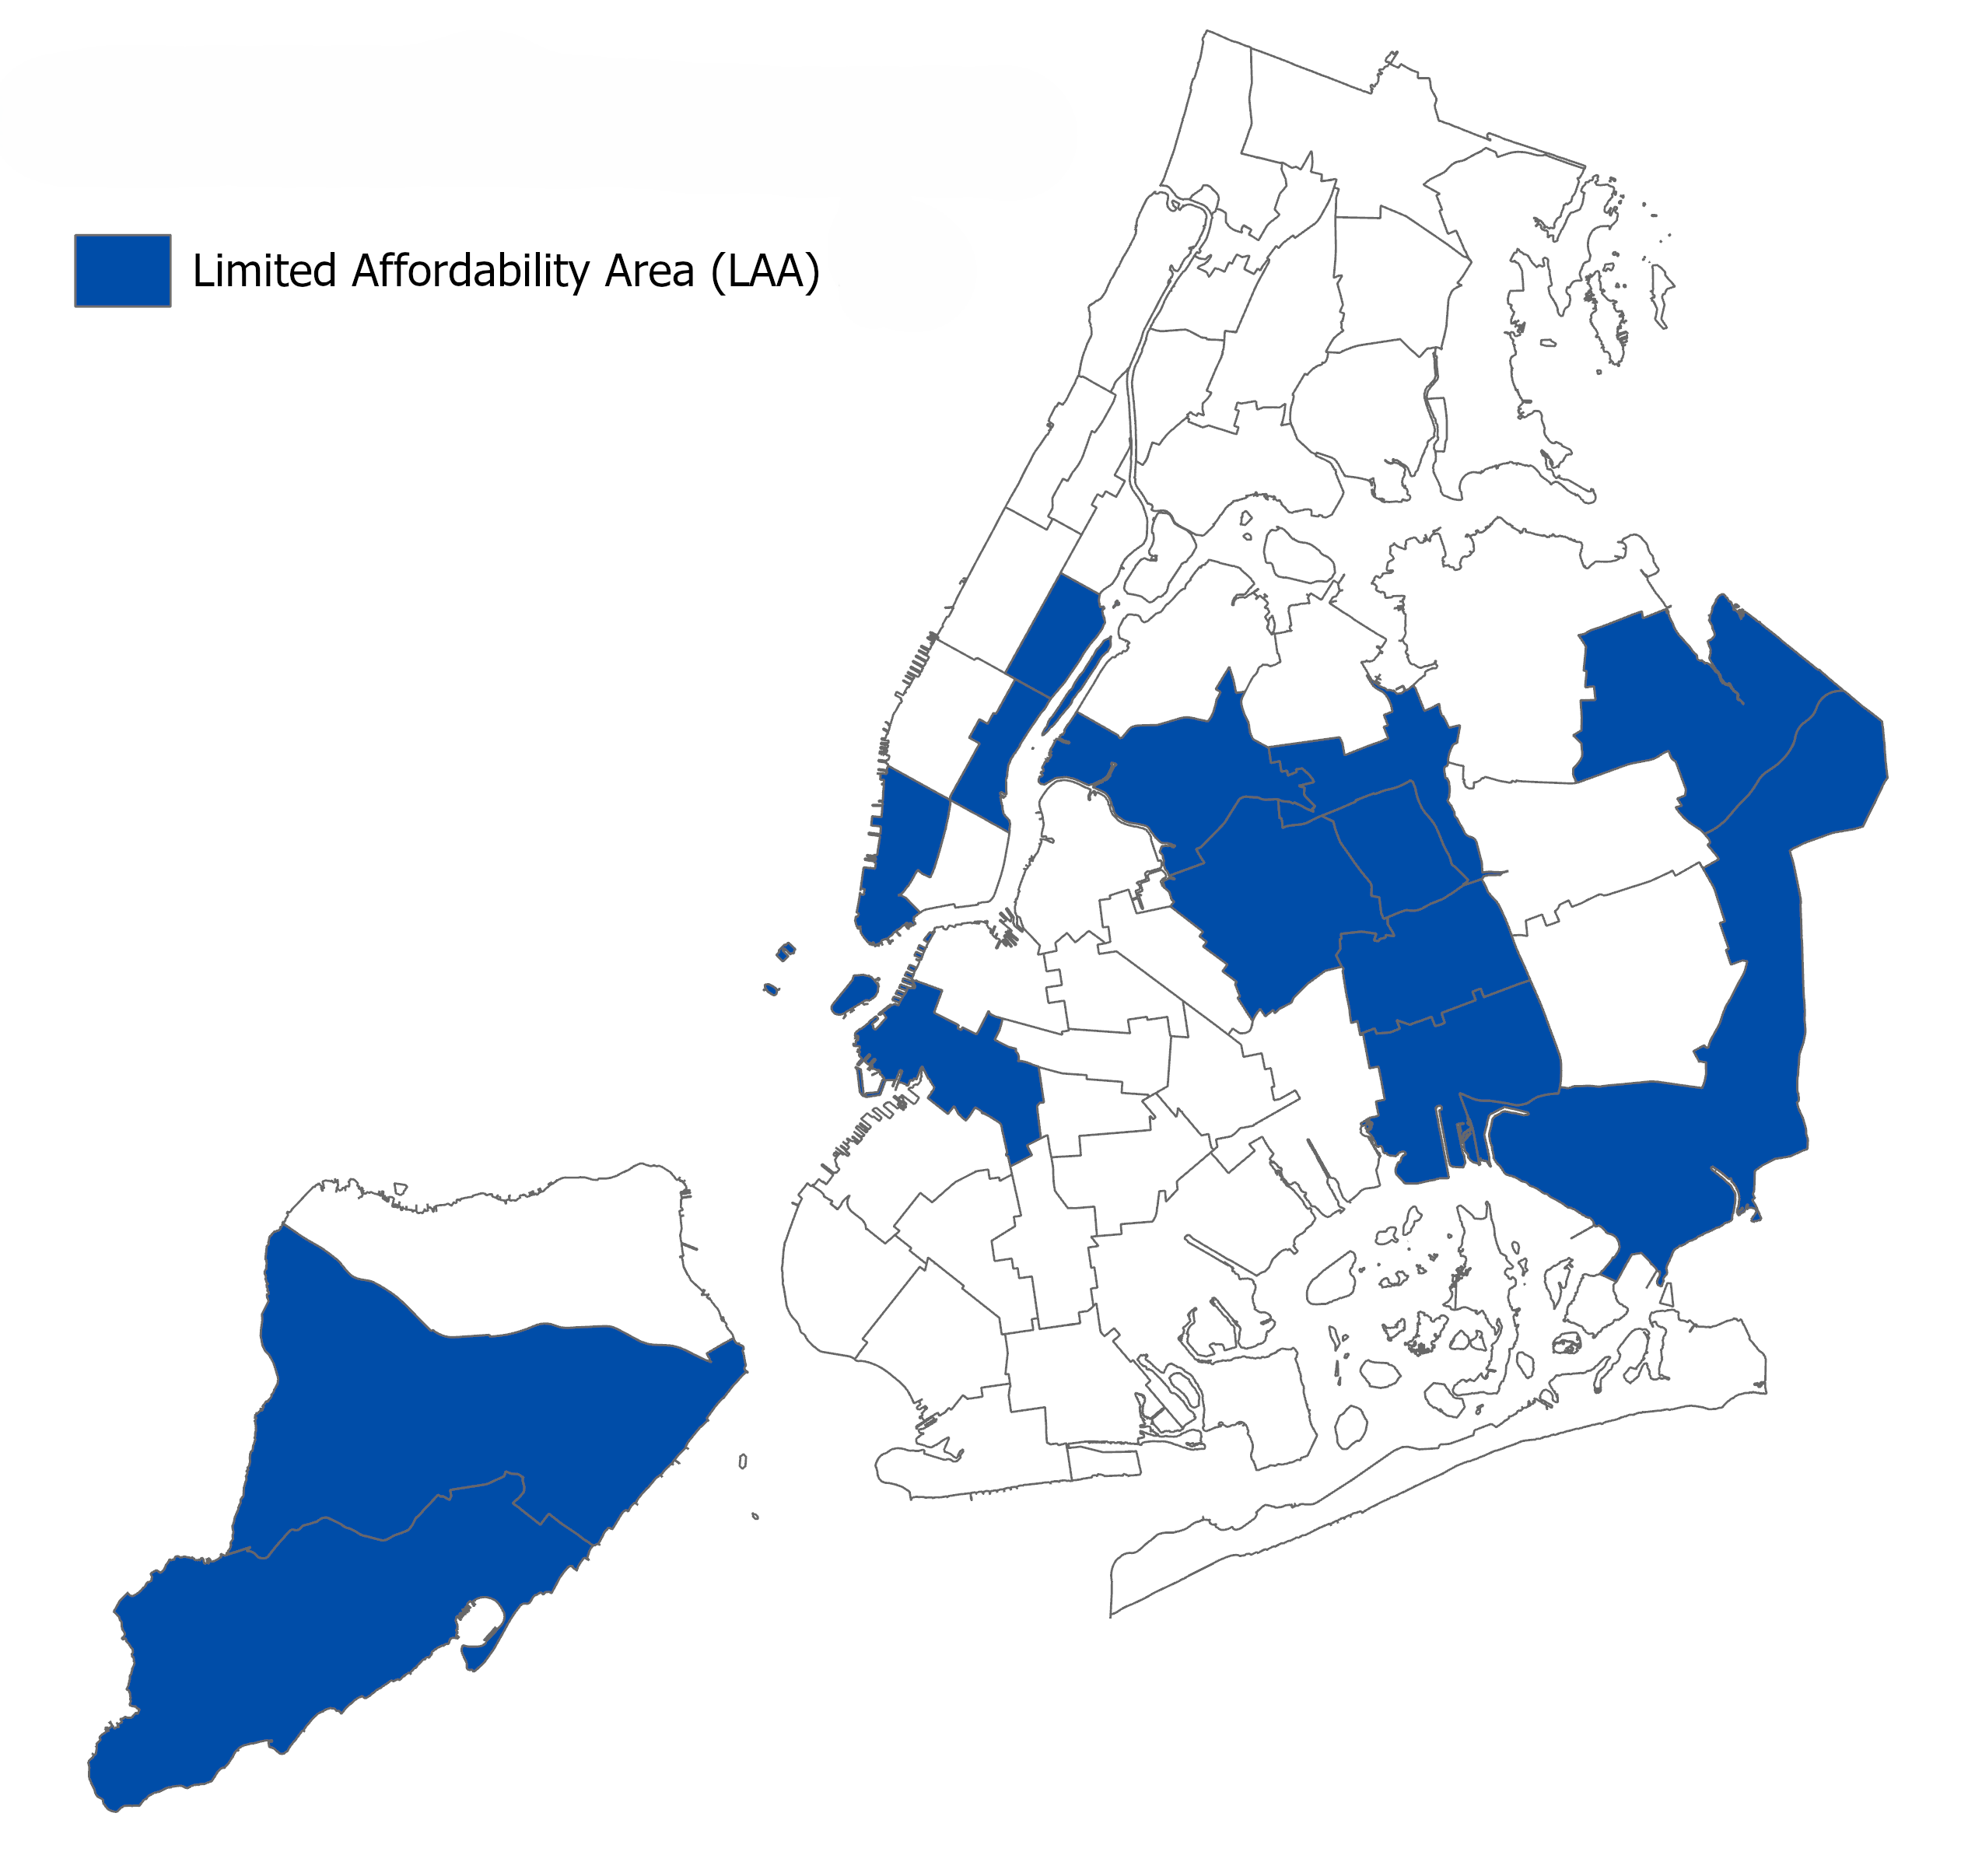
HPD defines Limited Affordability Areas as neighborhoods with the fewest affordable rental homes — both overall and those turned over within the last five years —based on ACS data. For both measures, affordability is defined as having a monthly rent less than 30% of the median household income by the unit’s number of bedrooms. While many LAAs are neighborhoods with higher housing costs, not all LAAs are more costly. LAA designation refers, specifically, to a lack of relatively affordable rental units.
GOAL 3
Protect existing affordable housing and prevent displacement
Promoting fair housing in a high-cost city also means supporting New Yorkers who want to stay in their home or neighborhood, even as it changes.
This is why it is critical to preserve existing affordable homes, including those in NYCHA developments or in rent-regulated buildings, while also supporting programs that protect tenants and homeowners from harassment and mistreatment.
Median Income by Race, 2019-2023
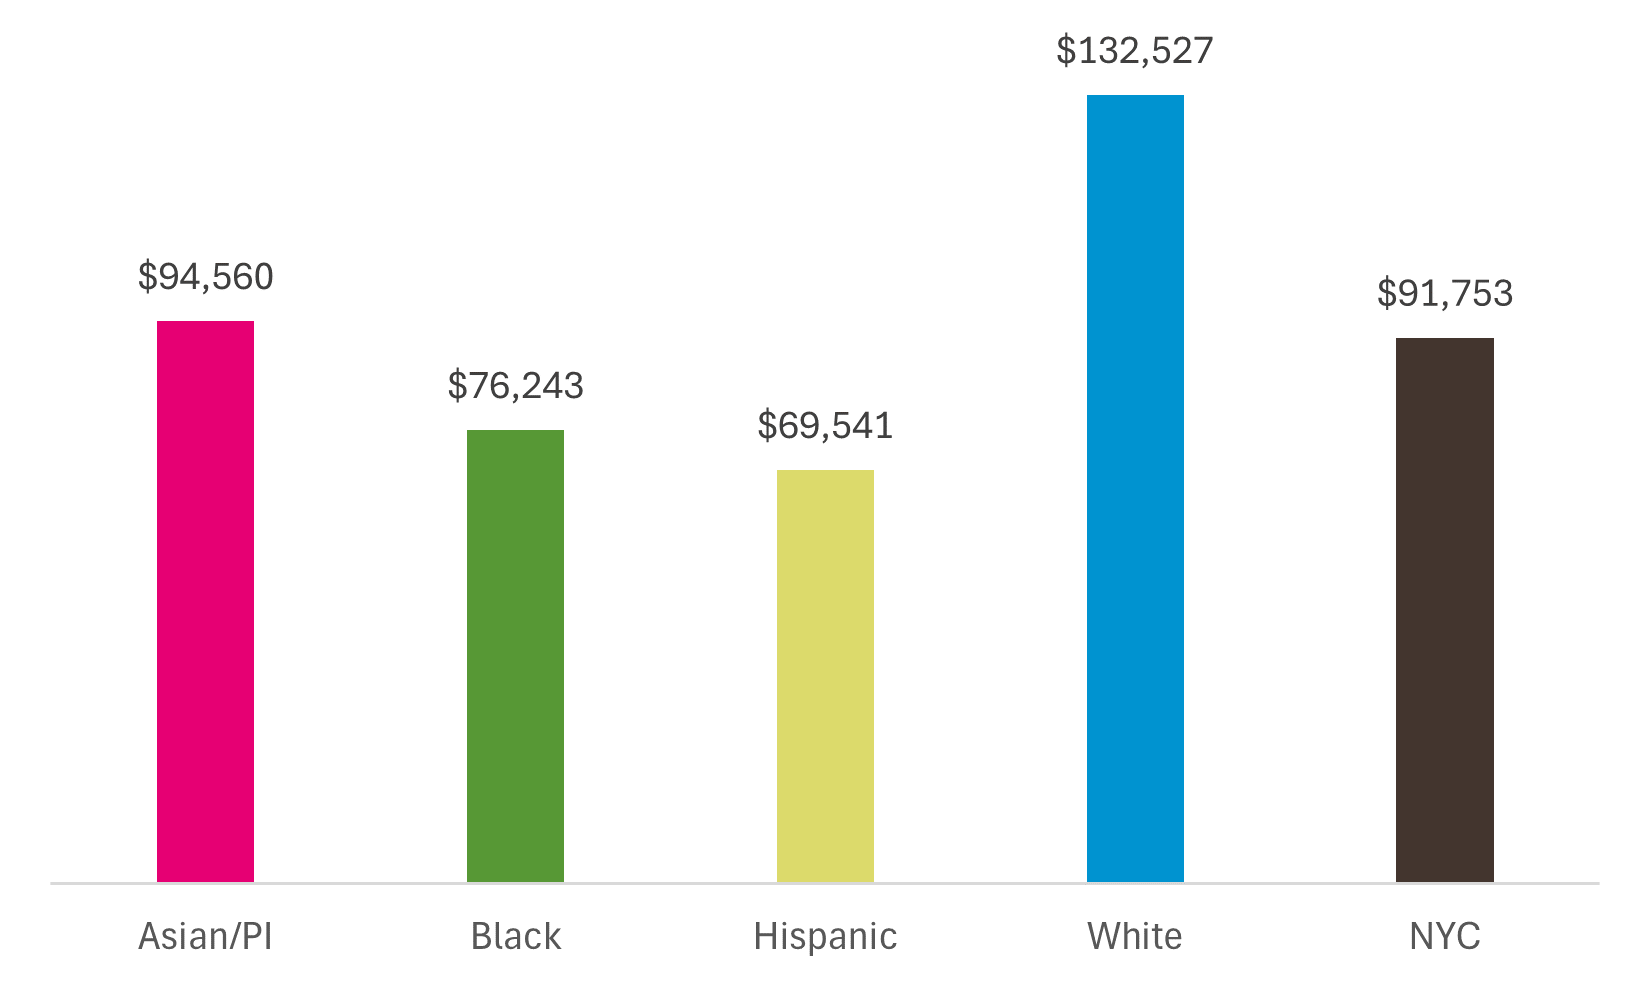
This figure presents data from the ACS showing that the median income for New York city households is $91,753. White New Yorkers have the highest median income at $132,527, significantly above the citywide average. Hispanic New Yorkers have the lowest median income at $69,541, while Black New Yorkers have a median income of $76,243 and Asian or Pacific Islanders in NYC have a median income of $94,560.
Rent Burden for Extremely Low and Very-Low Income Renter Households, 2023
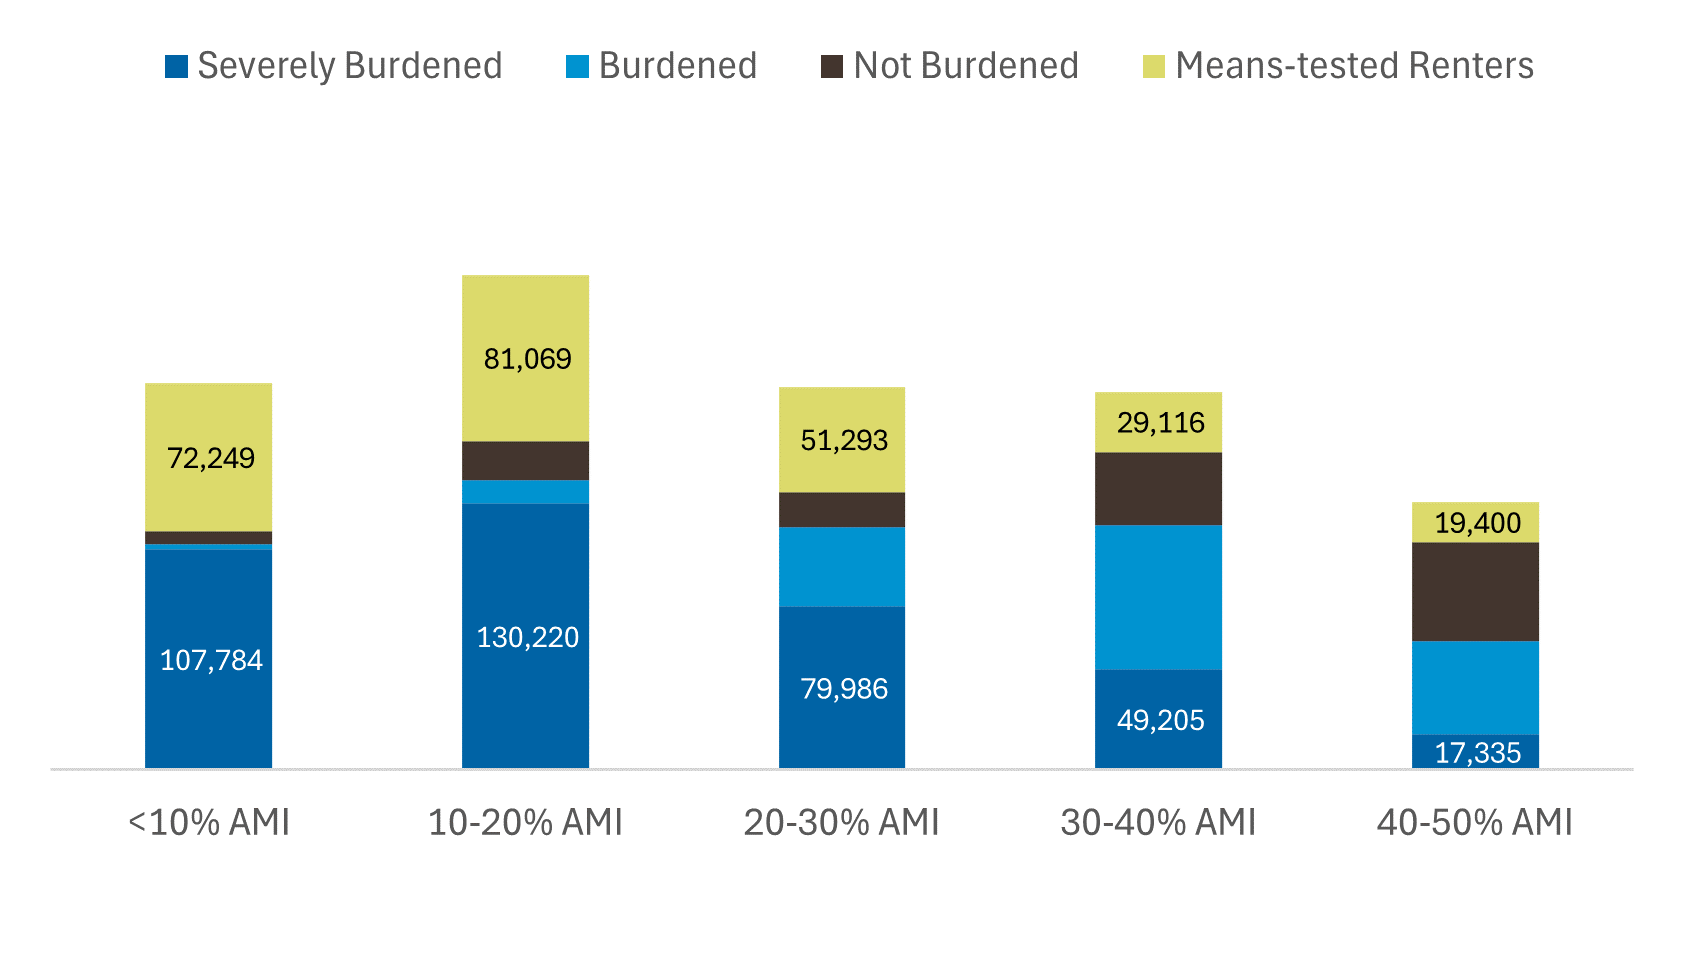
New Yorkers whose household incomes place them below 50% of HUD’s Income Limits (aka AMI) are more likely to be rent burdened (spending more than 30% of their gross income on rent) or severely rent burdened (spending greater than 50% of income on rent). This figure presents data on the number of New Yorkers in each income decile below 50% AMI who are rent burdened, severely rent burdened, not rent burdened, or living in means-tested housing as of the 2023 NYCHVS. Households whose income is less than 10% of AMI are much more likely to be severely rent burdened (107,784) than not rent burdened (5,934), and even those making 40-50% AMI are more likely to be at least moderately rent burdened than not rent burdened.
Share of homes with three or more housing problems by race, 2023
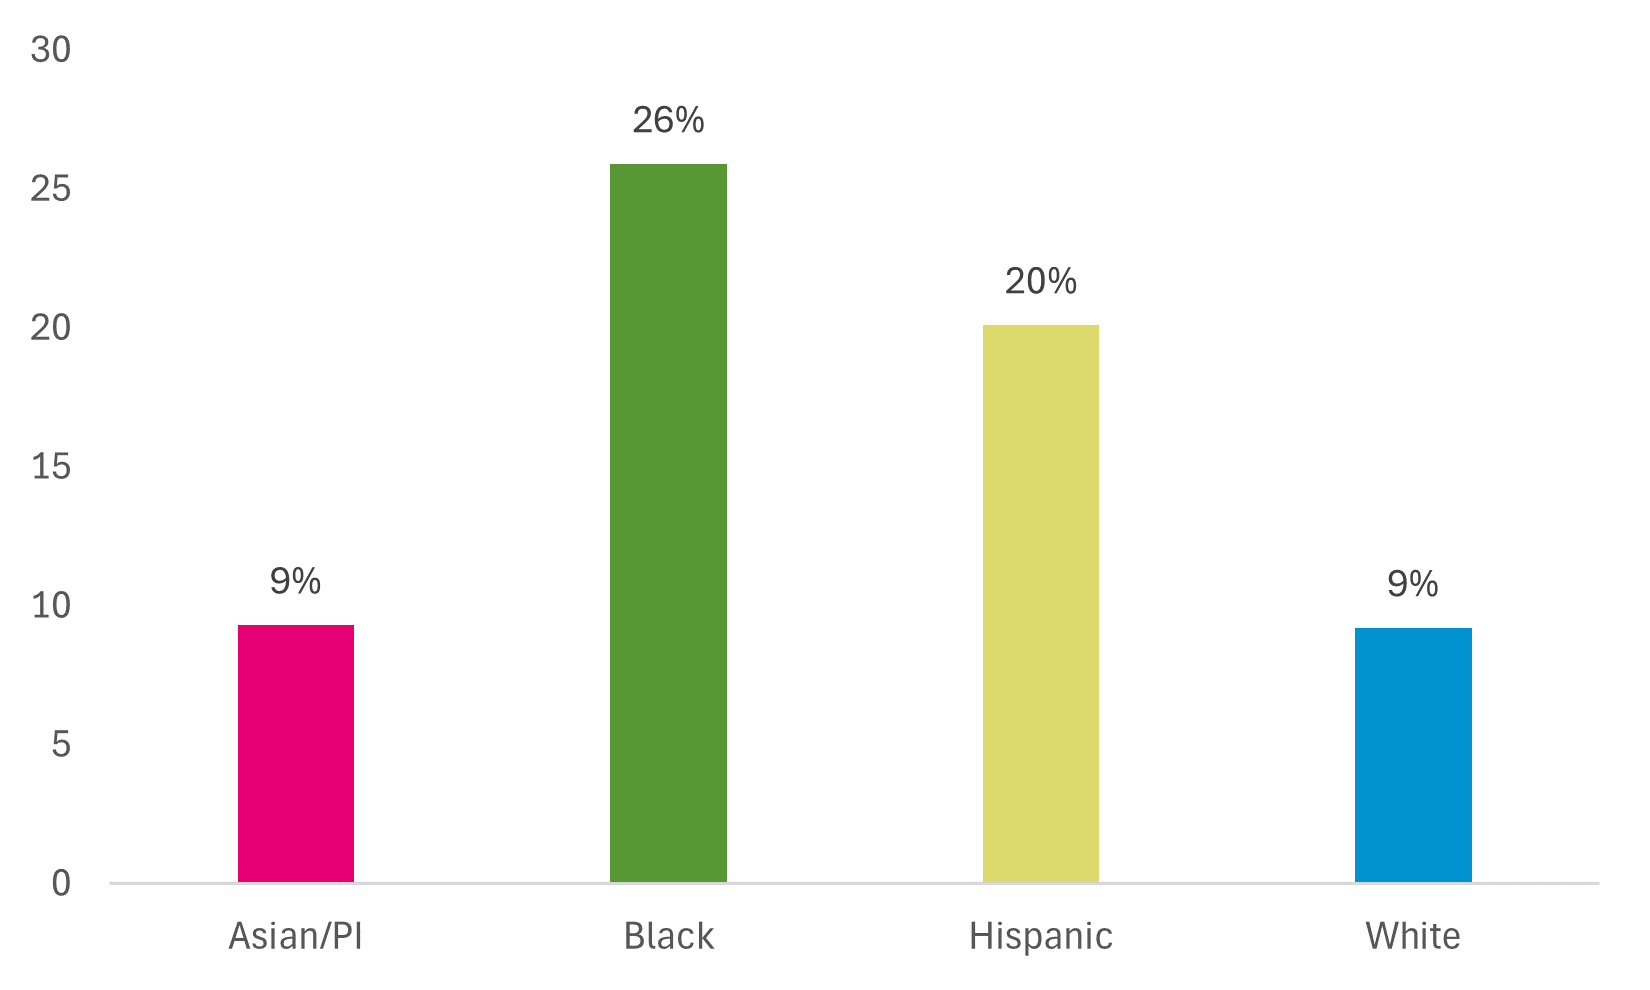
The NYCHVS reports on a range of potential problems with respondents’ homes. This figure reports the percentage of individuals in a given racial or ethnic group to report having at least three of the following problems with their housing units: heating breakdown of six hours or more, insufficient heat, leaks, rodents in the unit or building, toilets not working, holes in walls or floors, or large sections of peeling paint or broken plaster. In 2023, Black New Yorkers were the most likely to experience at least three of these problems (26%), followed by Hispanic New Yorkers (20%). The share of New Yorkers who were either Asian or Pacific Islander or White to report having three or more of these issues was 9%.
GOAL 4
Ensure access to different types of neighborhoods for tenants using housing vouchers
Many New Yorkers use rental assistance and vouchers to secure safe, stable, and affordable homes. But, across the nation and locally, residents using vouchers often live in neighborhoods with higher levels of poverty and lower performing schools.
A crucial part of promoting fair housing is ensuring New Yorkers using rental assistance have access to a diversity of neighborhoods. This is why the City is seeking to open more housing options to New Yorkers using rental assistance and improve the design of the program to better serve participating residents and landlords.
Share of Emergency Housing Vouchers by Borough

This figure reflects HPD Administrative Data as of August 2025. Despite representing a smaller share of the city’s total housing stock and mobility, Brooklyn and the Bronx together accounted for 73% of all voucher-based moves during this period, reinforcing patterns of geographic concentration.
GOAL 5
Expand and improve housing options and accommodations for people with disabilities
New Yorkers with disabilities face unique challenges when it comes to finding housing that is affordable, safe, and accessible. Many residents with disabilities live in institutional settings, such as nursing homes, without meaningful opportunities to live independently and interact with individuals without disabilities.
A crucial part of promoting fair housing is ensuring New Yorkers with disabilities have housing options that allow them to be independent and integrated through coordinated support and more accessible options.
Share of homes not requiring stairs by housing type, 2023
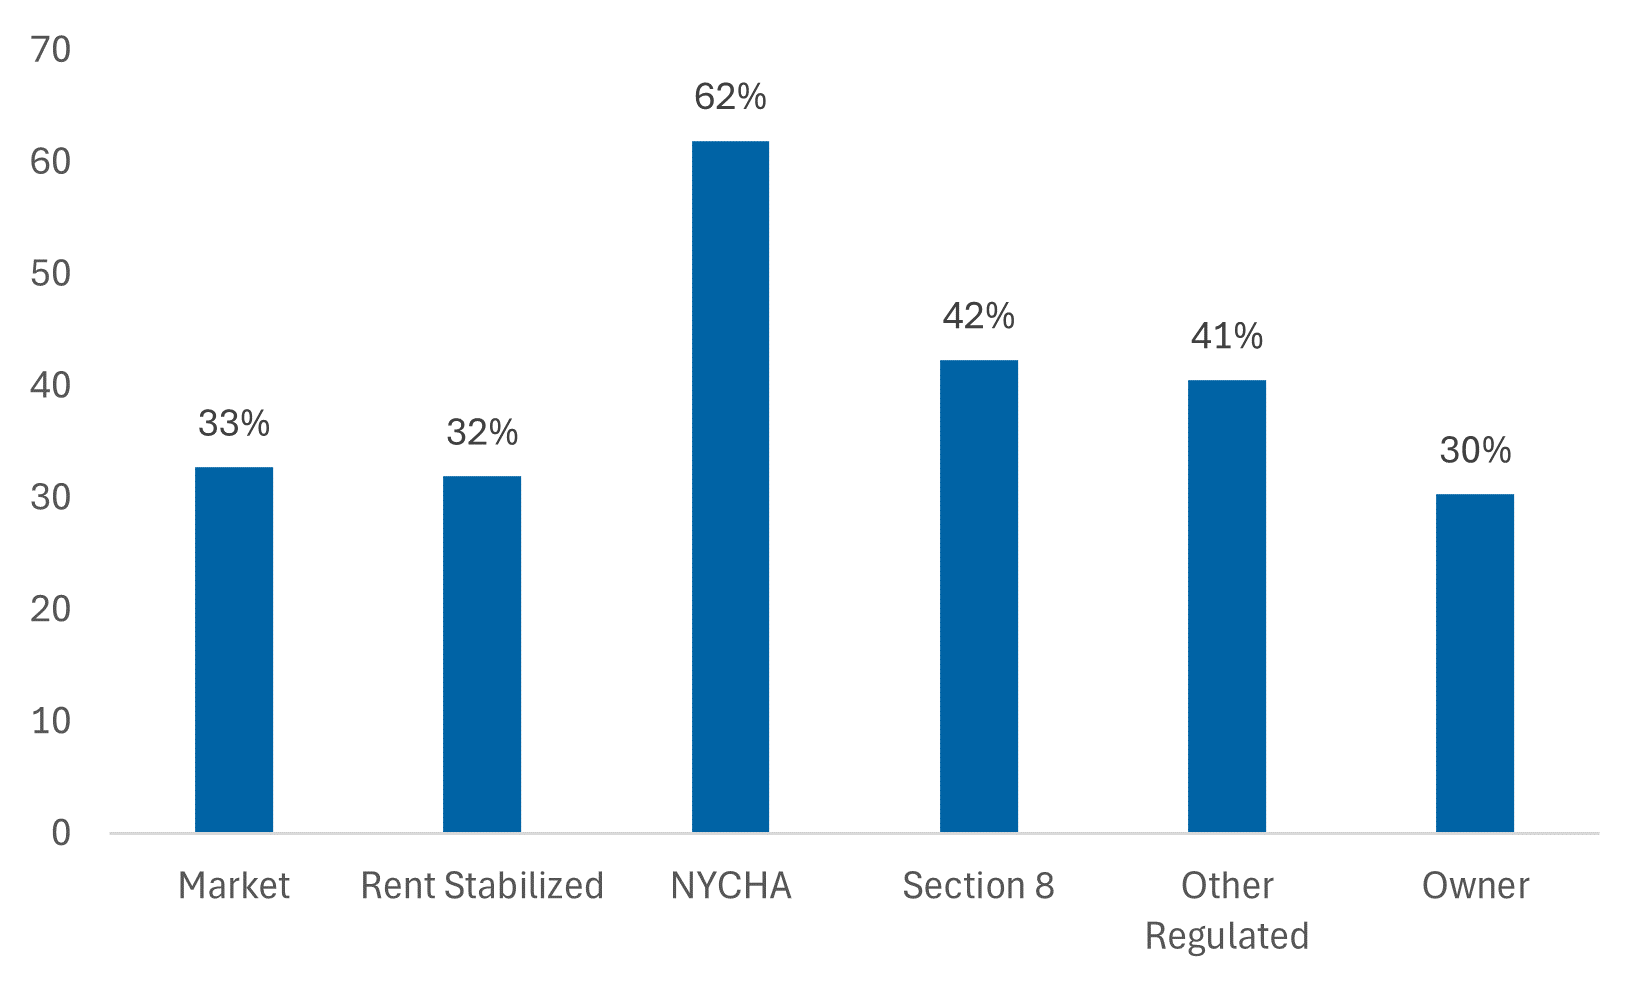
One measure of the accessibility of New York City housing to New Yorkers with mobility difficulties is the share of homes that are accessible without climbing any stairs to enter. This figure shows that as of the 2023 NYCHVS, only around a third of homes citywide (34%) meet this standard. The only type of housing where a majority of homes are accessible without stairs is in New York City Housing Authority (NYCHA) public housing developments, where 62% of units do not require stairs to enter. Section 8 units have the next highest rate at 42%, while homeownership units have the lowest share at 30%.
Subway station accessibility, 2025
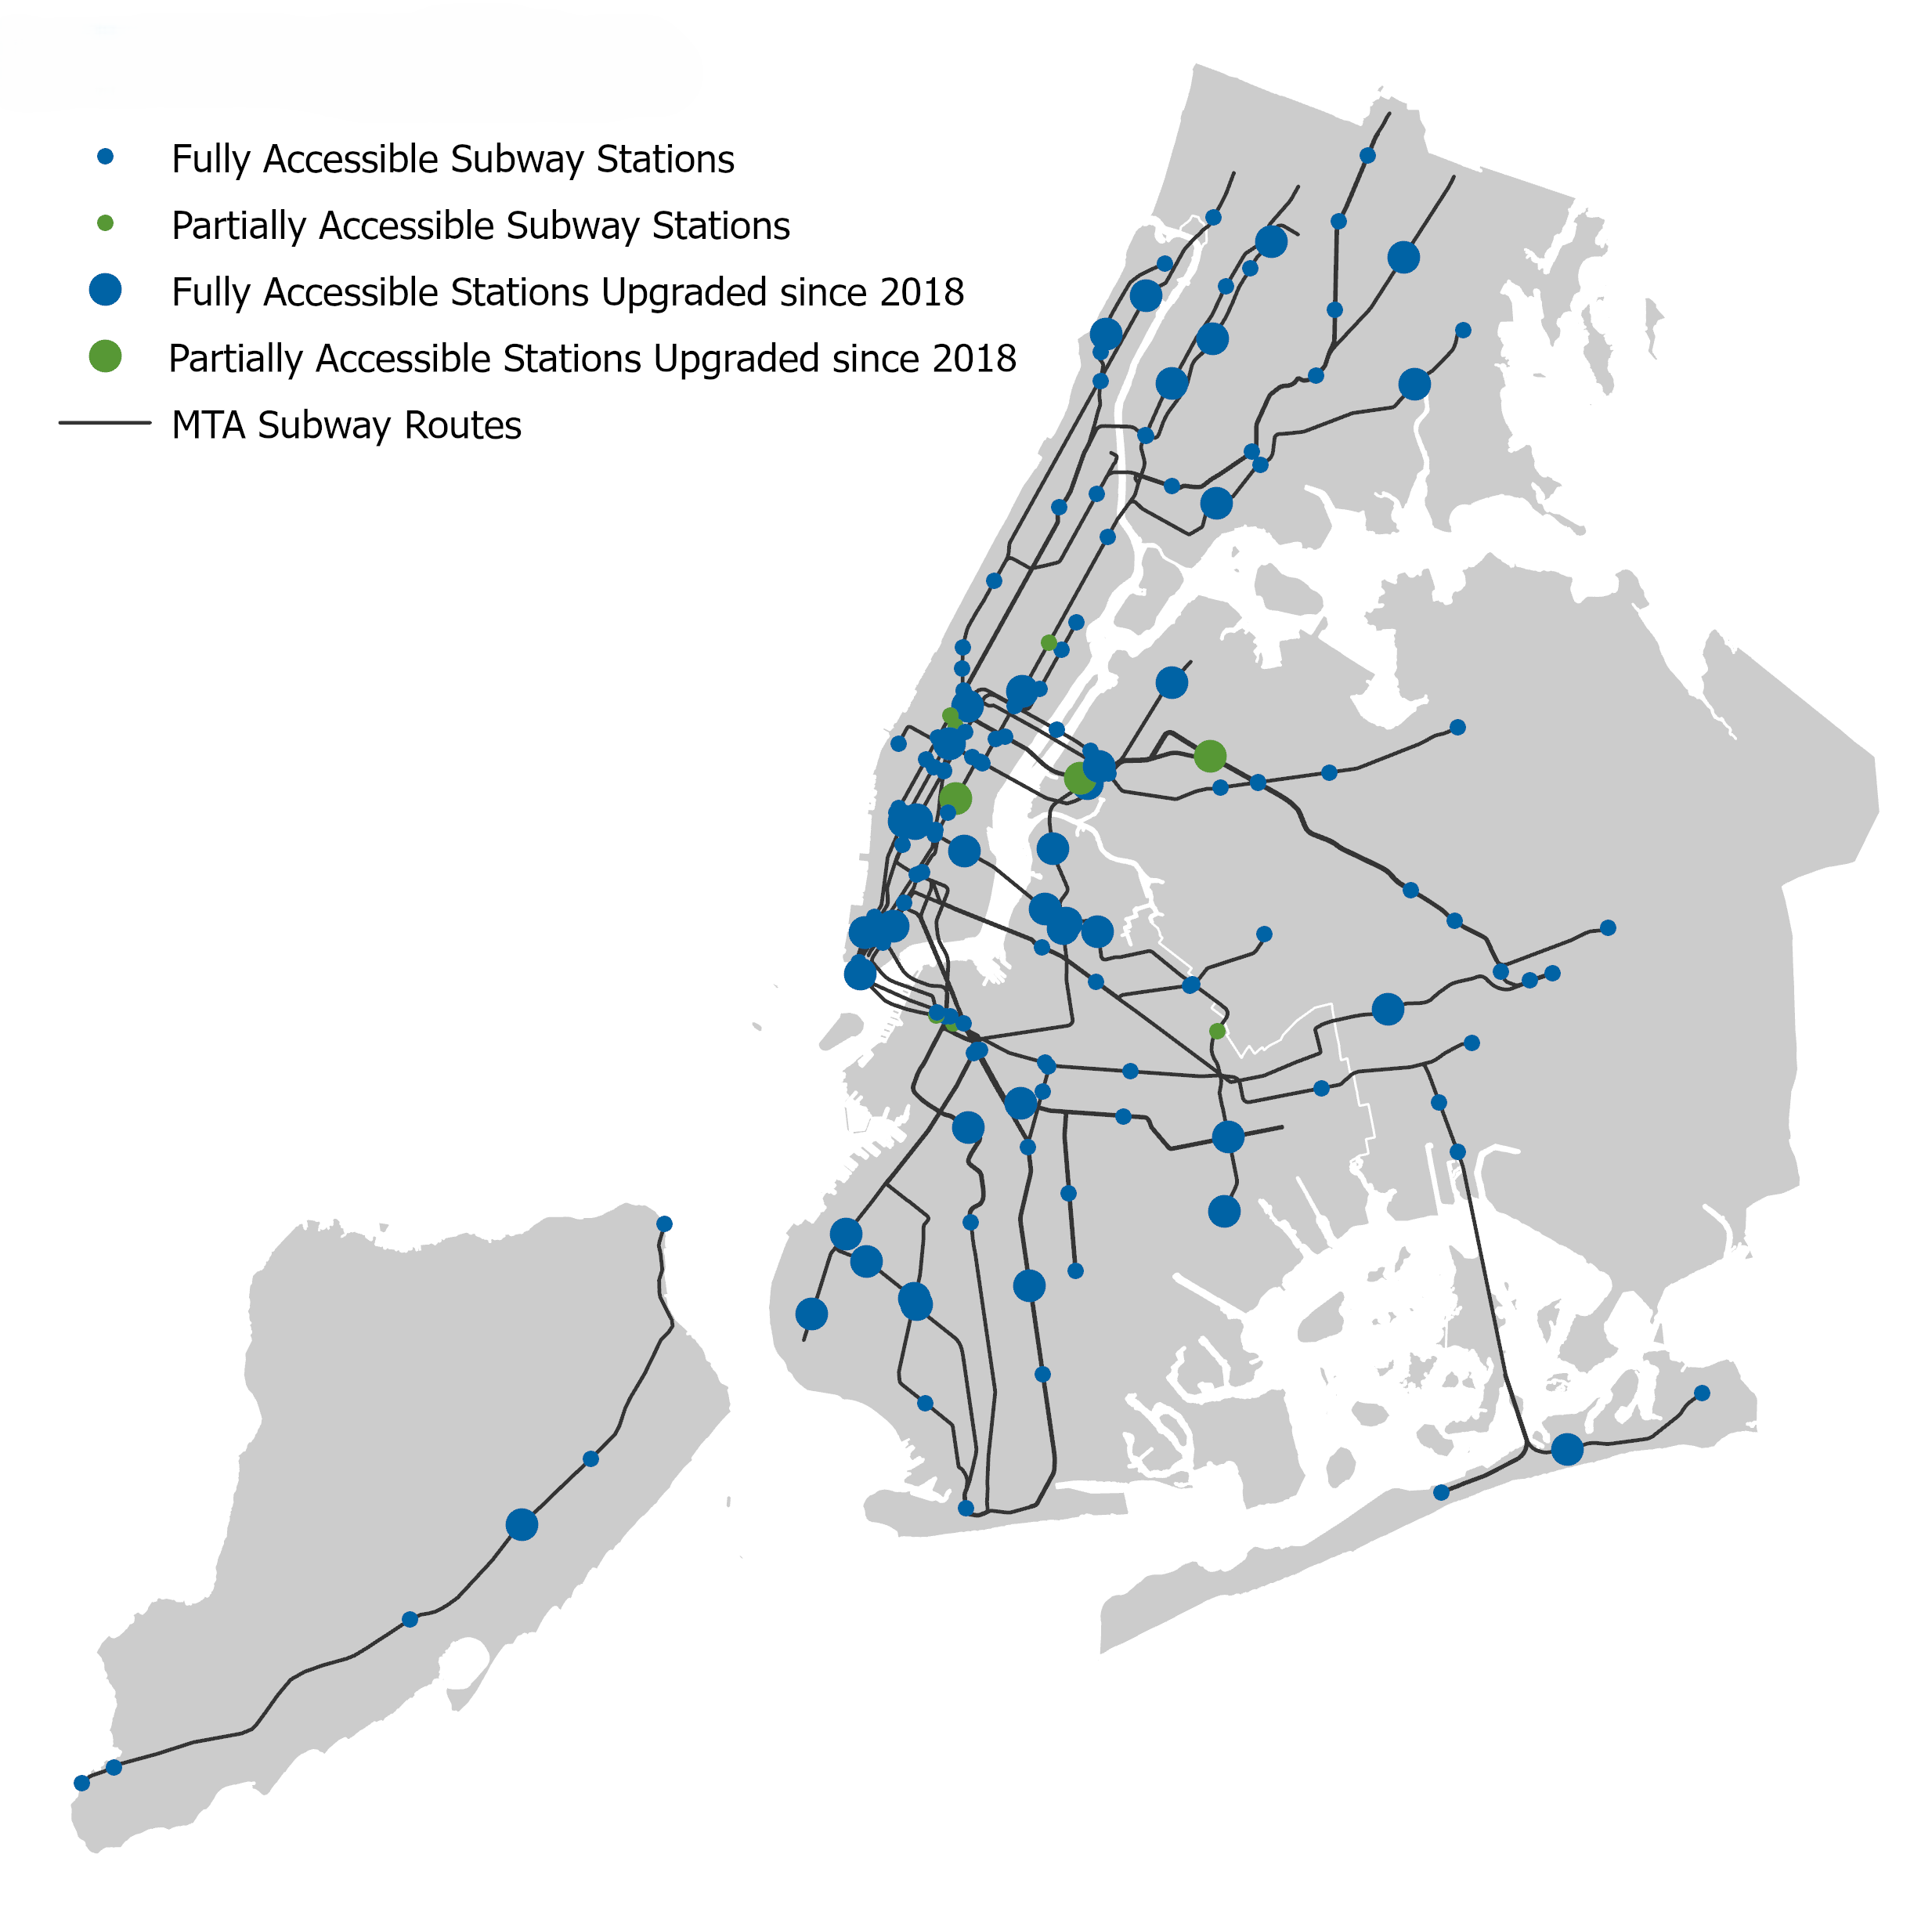
Approximately 30% (152) of New York City’s 493 subway stations are currently fully accessible, with an additional nine stations that are partially accessible. Of these 161 full or partially accessible stations, over 25% (43) received accessibility upgrades since July 2018, with at least one station receiving an accessibility upgrade in each of the five boroughs. In 2022, the MTA committed to making 95% of the system’s stations accessible by 2055.
GOAL 6
Improve conditions, services and infrastructure in historically disinvested neighborhoods
New York City—like all cities in the United States—is scarred by a long history of discrimination, segregation, and concentrated poverty. This history has particularly impacted neighborhoods that people of color call home.
Affirmatively furthering fair housing means addressing the structural disadvantages that these neighborhoods and their residents experience so that no one is deprived of high-quality resources and services because of their race, ethnicity, disability, religion, or other protected characteristic, and that residents of all neighborhoods have the resources they need to thrive.
Share of households with Broadband Internet access, 2019-2023

While New York City has expanded high-speed internet access to reach 74% of households citywide as shown in this figure, there are still nearly 850,000 households without broadband access according to ACS data. Broadband access varies widely by neighborhood and borough. Coverage rates are particularly low in the Bronx, where only 60% of households have coverage across most of the borough. By comparison, 90% of households have access to broadband in most Manhattan neighborhoods.
Heat Vulnerability Index, 2024

The Heat Vulnerability Index is a measure identifying the neighborhoods where residents are most at risk from extreme heat. Using data aggregated by the Department of Health and Mental Hygiene, Neighborhood Tabulation Areas are visualized in the above figure using a score from 1 (lowest risk, lightest blue) to 5 (highest risk, darkest blue). Scores reflect how each neighborhood ranks based on key social and environmental factors associated with high heat risk: surface temperature, green space, access to home air conditioning, and the percentage of residents who are low-income or non-Hispanic Black.
*Most figures are based on data from either the 2019-2023 American Community Survey 5-year estimates (ACS) or the 2023 New York City Housing and Vacancy Survey (NYCHVS). Other datasets are referred to by their full names.
Data sources:
2019-2023 American Community Survey (ACS)
2023 New York City Housing and Vacancy Survey (NYCHVS)
2024 Home Mortgage Disclosure Act (HMDA) loan data
NYC DCP Housing Database
NYC Affordable Housing Production by Building
MTA Subway Stations
NYC DOHMH Heat Vulnerability Index
NYC Housing Preservation and Development (HPD) Administrative Data, August 2025