Employment
The information below includes preliminary data findings that will be updated throughout the Where We Live NYC process and do not represent the City of New York’s final findings or position on the information.
New York City is by far the most populous city in the United States, and the city is the center of the country’s largest metropolitan economy. According to the U.S. Bureau of Labor Services (BLS), New York City is home to 4.3 million jobs and its region to 10.4 million jobs1. In 2016, the New York City region accounted for 9.5% of U.S. gross domestic product2. However, prosperity in New York City is not shared equally, and there are disparities in employment outcomes and access to wealth-building opportunities across many populations.
The first part of this brief explores geographic patterns of access to jobs and other wealth-building opportunities across New York City. These indicators may provide insight into how residential living patterns generally—and housing segregation specifically3— create or perpetuate disparate outcomes with respect to labor force participation, income, and wealth. The second part examines outcomes associated with employment and wealth-building by race, ethnicity, and disability status.
Geographic Patterns of Jobs and Wealth-Building Opportunities4
The accessibility of job centers well served by public transit and the availability of wealth-building opportunities, such as the location of financial institutions and affordable homeownership opportunities, vary significantly across New York City.
Core Manhattan, northwest Brooklyn, Long Island City, central Staten Island, and Riverdale rank most highly on a national index measuring geographic patterns of labor force participation and educational attainment. The U.S. Department of Housing and Urban Development (HUD) created the Labor Market Engagement Index as a measure of the relative intensity of labor market engagement and higher educational attainment in a neighborhood5. It takes into account unemployment, labor force participation, and bachelor’s degree rates at the census-tract level and assigns a value ranging from 0 to 100 that is ranked nationally. The higher the number, the stronger the labor market engagement and educational attainment in the neighborhood. The Labor Market Index map below shows that the greatest concentration of tracts scoring high on the Labor Market Engagement Index are located in Manhattan, as well as northwest Brooklyn and Long Island City.
Most employment hubs with good transportation access are located in Lower and Midtown Manhattan. The Job Centers and Transit map below shows employment hubs in New York City, as well as subway stations. Employment hubs are defined as areas with a high concentration of workers. Many job centers are well connected to transit throughout the city, though Queens, eastern Brooklyn, and Staten Island are relatively less served. Additionally, not all job centers offer the same types of opportunities. Lower and Midtown Manhattan, for instance, provide higher paying employment opportunities than many of the other employment hubs seen on this map, but the highest-paying jobs may have various barriers to entry6.
New Yorkers living in Manhattan, Downtown Brooklyn, and Long Island City have the shortest commute times. The Commute Time to Work map below shows the average commute time to work by census tract, regardless of the mode of transportation. Low commute times are largely concentrated in Lower Manhattan and Midtown and, to a lesser degree, in Downtown Brooklyn and Long Island City. New Yorkers living in the farthest reaches of outer boroughs experience the longest commute times on average.
Access to financial institutions is easiest in Lower and Midtown Manhattan. The Financial Institution Access map below shows the distribution of bank branches and credit unions across the city. Unsurprisingly, Midtown and Lower Manhattan have the highest concentration of banks and credit unions, while outer boroughs have the lowest concentration of banks and credit unions.
Opportunities for affordable homeownership are largely limited to outer boroughs. Many areas in the city are out of reach for those earning a middle income and interested in buying a home7. The Homes Sales Prices map below shows the share of 1-4 unit buildings and condominium units sold in 2017 with a price at or below $470,000. Opportunities for affordable homeownership are limited to the Bronx, Staten Island, southern and eastern Brooklyn, and southeast Queens8.
Differences in Employment Access and Outcomes by Protected Class
Although the NYC metropolitan region is experiencing significant job growth—including the addition of 708,000 jobs since 20089— there are disparities among specific populations in current rates of labor force participation and educational achievement.
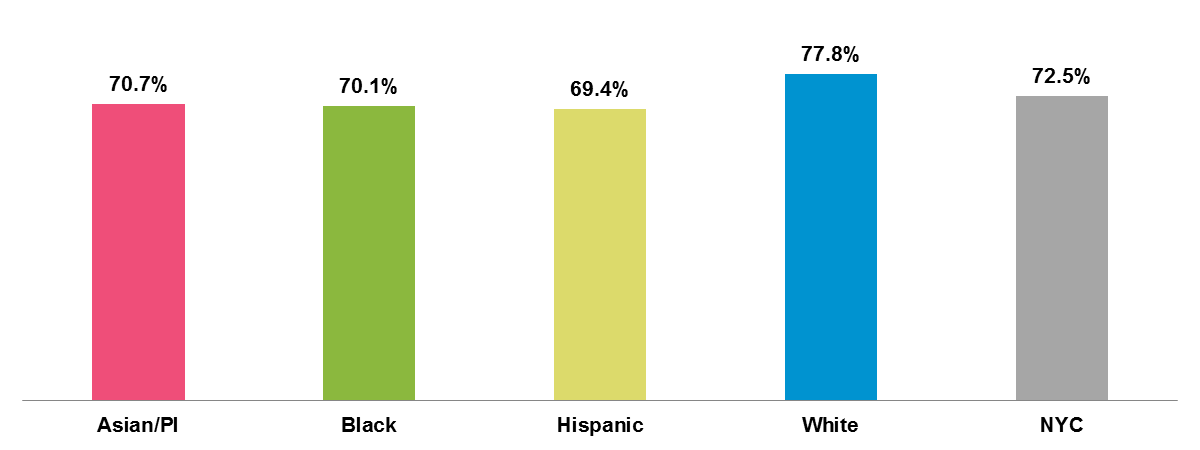
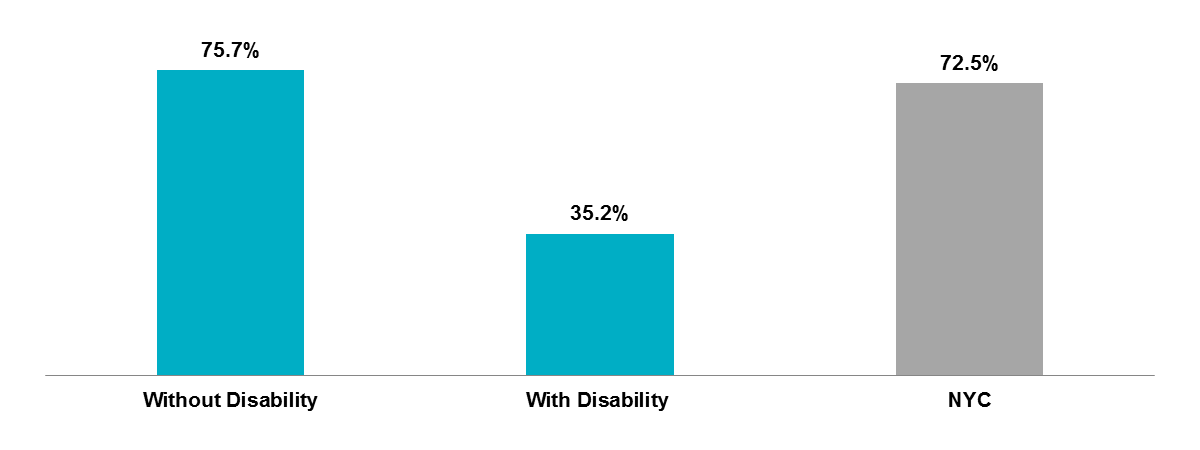
Labor force participation varies by race, ethnicity10, and disability11 status. Labor force participation captures the number of adults who are working or who are looking for a job. Reasons for not participating in the labor force may include having a disability or a family member with a disability, providing unpaid care for a family member, retirement, or being discouraged from looking for a job. The Labor Force Participation Rate by Race and Ethnicity chart below shows labor force participation rates by race and ethnicity, while the Labor Force Participation Rate by Disability Status chart below shows labor force participation rates by disability status. White New Yorkers have the highest labor force participation rate (77.8%), while other racial and ethnic groups have comparable labor force participation rates (ranging from 69.4% to 70.7%). New Yorkers with disabilities have a noticeably lower labor force participation rate than New Yorkers who do not have a disability (35.2% and 75.7%, respectively).
Labor Force Participation Rate by Race and Ethnicity, 2012-201612
Labor Force Participation Rate by Disability Status, 2012-201613
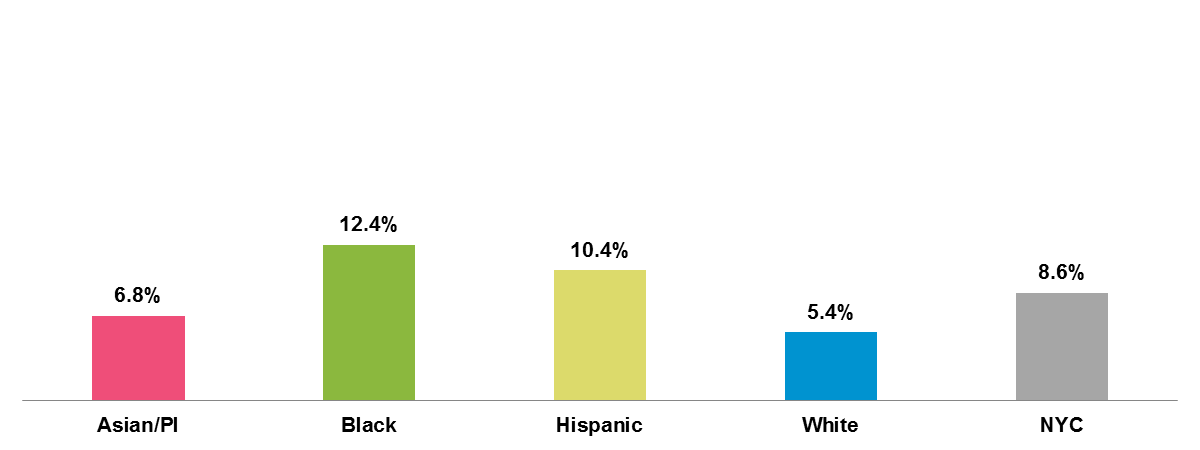
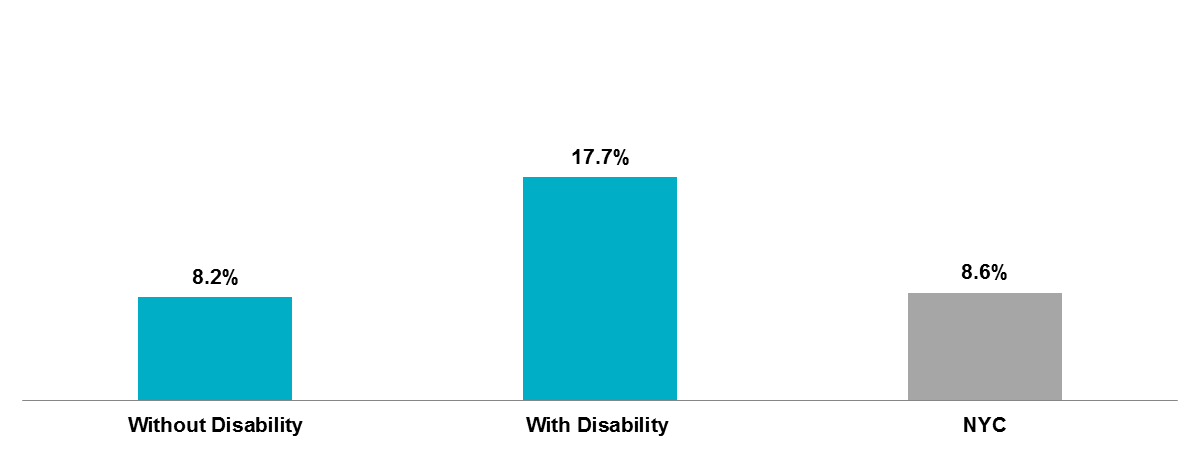
Unemployment rates differ by race, ethnicity, and disability status. The Unemployment Rate by Race and Ethnicity chart and the Unemployment Rate by Disability Status chart below focus on the share of New Yorkers who participate in the labor force and are currently unemployed. Black, Hispanic, and disabled New Yorkers have higher unemployment rates (12.4%, 10.4%, and 17.7%, respectively) than the New York City average (8.6%). Unemployment is particularly low among Asian/PI and White New Yorkers (6.8% and 5.4%, respectively).
Unemployment Rate by Race and Ethnicity, 2012-201614
Unemployment Rate by Disability Status, 2012-201615
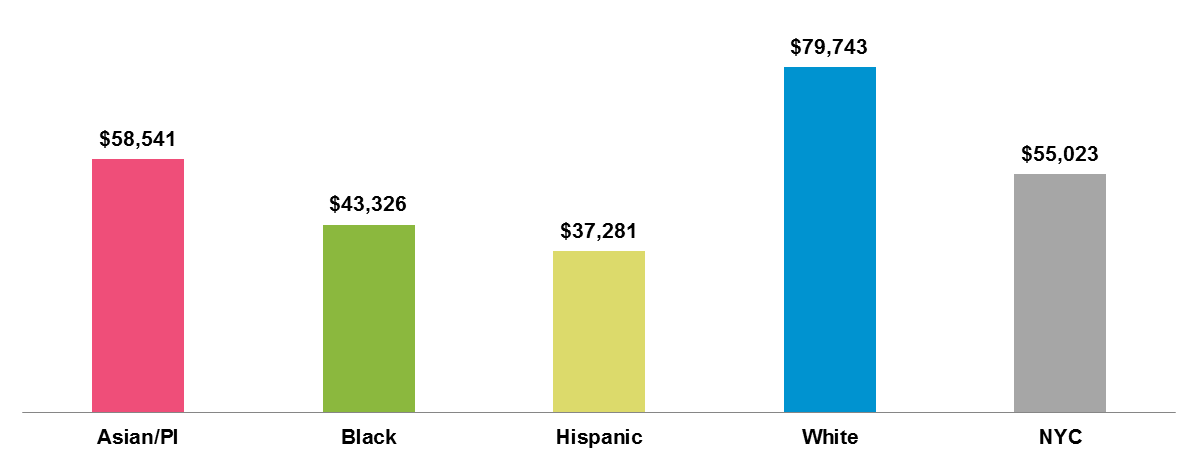
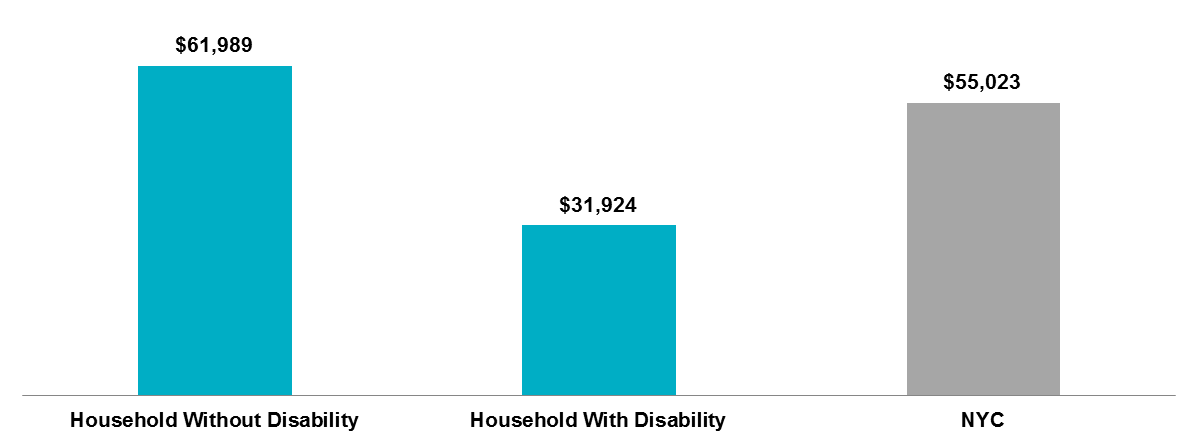
Household income varies by race, ethnicity, and disability status. Median household income by race and ethnicity is presented on the Median Household Income by Race and Ethnicity chart below. Households with a White householder have the highest median income ($79,743), compared to households with an Asian/PI householder ($58,541), a Black householder ($43,326) and a Hispanic householder ($37,281). Households with a household member who is disabled have a median income of $31,924, as shown on the Median Household Income by Disability Status chart below.
Median Household Income by Race and Ethnicity, 2012-201616
Median Household Income by Disability Status, 2012-201617
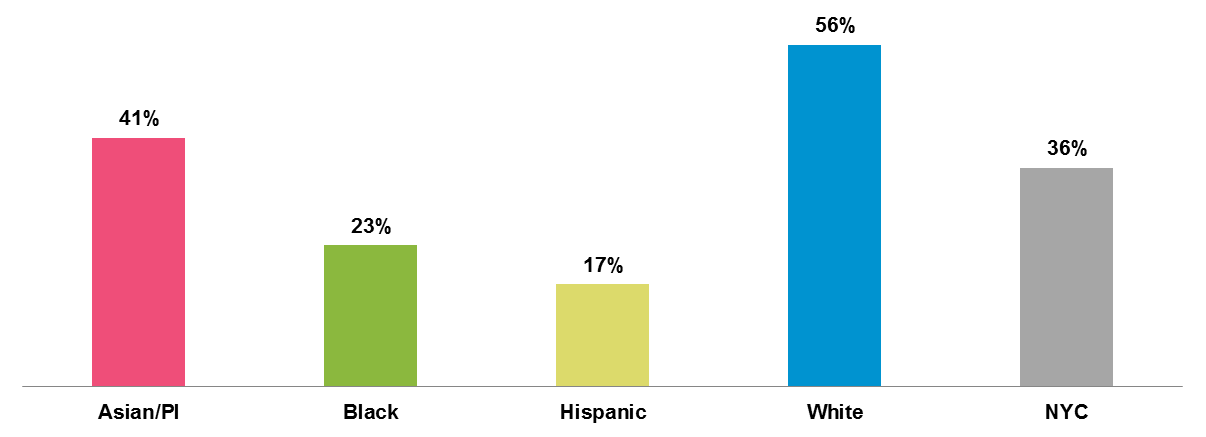
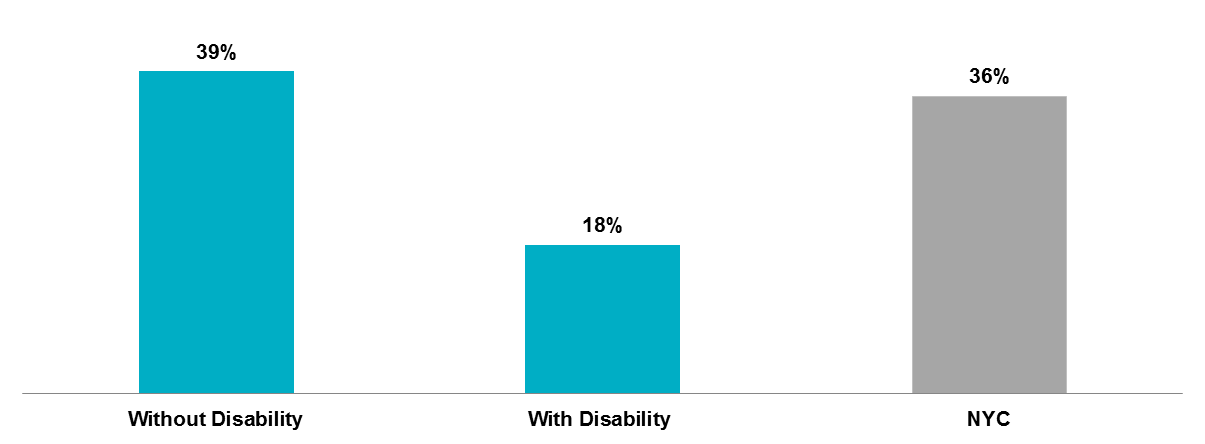
There are differences in educational attainment across racial and ethnic groups, as well as disability status. The share of adults aged 25 years or older with a bachelor’s degree or higher is shown on the Educational Attainment by Race and Ethnicity chart below by race and ethnicity. White and Asian/PI New Yorkers are more likely to have a college degree than the city average (56% and 41%, as compared to 36%), and the shares of Black and Hispanic New Yorkers with a college degree are below the city average (23% and 17%, respectively). The Educational Attainment by Disability Status chart below shows that New Yorkers without a disability are more than twice as likely to have a college degree or higher compared to New Yorkers with a disability.
Educational Attainment by Race and Ethnicity, 2012-201618
Educational Attainment by Disability Status, 2012-201619
- NYC Department of City Planning (2018), “The Geography of Jobs: NYC Metro Region Economic Snapshot,” retrieved on October 24, 2018, from: https://www1.nyc.gov/assets/planning/download/pdf/about/dcp-priorities/data-expertise/nyc-geography-jobs-0718.pdf.
- Bureau of Economic Analysis (2018), “GDP by Metropolitan Area,” retrieved on October 24, 2018, from: http://www.bea.gov/data/gdp/gdp-metropolitan-area.
- HPD has also prepared a separate brief that includes information on neighborhood racial concentration. Please see the Where New Yorkers Live tab.
- Unless otherwise noted, this page uses data primarily from the 2012-2016 American Community Survey, the latest five-year estimates available at the time of writing. All estimates are subject to both sampling and nonsampling error. Estimates based on five-year estimates, such as 2012-2016 ACS data, may obscure considerable changes in neighborhood conditions occurring throughout that period of time.
- HUD’s Labor Market Engagement Index is based on 2006-2010 American Community Survey data, the latest available from HUD’s data tool at the time of writing. HPD is exploring alternative methods for a similar analysis in the final report.
- The Manhattan core is by far the largest and most accessible job center in the city, and the diversity of jobs available in the Manhattan core as compared to other employment hubs will be explored in more depth in the final report.
- “Middle income” is defined as income of no more than $136,000 for a family of four. Such income would generally permit monthly mortgage payments for a home valued at approximately $470,000.
- Data used in this analysis include sales of both unregulated homes and homes with affordability restrictions; however, HPD affordable homeownership programs do not have geographic limitations.
- NYC Department of City Planning, “The Geography of Jobs.” See note 1.
- Unless otherwise specified, we define Asian/PI, black, and White groups as being non-Hispanic. Because the U.S. Census Bureau uses the term “Hispanic” in its population figures, the City will also use the term with regard to its population analyses. The City will use the term “Latinx” when relevant. Each of these categories also encompasses significant diversity and a range of national origins, which vary across the city’s neighborhoods. This diversity will be explored in the final report.
- The labor force participation rate of New Yorkers living with a disability is generated from the American Community Survey (ACS), which asks respondents to report whether a member of their household is living with a disability. Specifically, ACS asks respondents whether a household member experiences any (1) hearing difficulty; (2) vision difficulty; (3) cognitive difficulty; (4) ambulatory difficulty; (5) self-care difficulty; or
(6) independent living difficulty. - Proportion of the population ages 16-64 that is in the civilian labor force, regardless of employment status. Sources: American Community Survey (ACS) 2012-2016, 5-Year Public Use Microdata Sample (PUMS). Limited to age 16 to 64 noninstitutionalized population. The labor force includes all people (16-64) classified in the civilian labor force, plus members of the U.S. Armed Forces (people on active duty with the United States Army, Air Force, Navy, Marine Corps, or Coast Guard).
- Proportion of the population ages 16-64 that is in the civilian labor force, regardless of employment status. Sources: American Community Survey (ACS) 2012-2016, 5-Year Public Use Microdata Sample (PUMS). Limited to age 16 to 64 noninstitutionalized population. The labor force includes all people (16-64) classified in the civilian labor force, plus members of the U.S. Armed Forces (people on active duty with the United States Army, Air Force, Navy, Marine Corps, or Coast Guard).
- The number of unemployed people as a percentage of the civilian labor force (ages 16-64). Sources: American Community Survey (ACS) 2012-2016, 5-Year Public Use Microdata Sample (PUMS). Limited to age 16 to 64 noninstitutionalized population in labor force. All civilians 16 years old and over are classified as unemployed if they (1) were neither “at work” nor “with a job but not at work” during the reference week, and (2) were actively looking for work during the last 4 weeks, and (3) were available to accept a job. Also included as unemployed are civilians who did not work at all during the reference week, were waiting to be called back to a job from which they had been laid off, and were available for work except for temporary illness.
- The number of unemployed people as a percentage of the civilian labor force (ages 16-64). Sources: American Community Survey (ACS) 2012-2016, 5-Year Public Use Microdata Sample (PUMS). Limited to age 16 to 64 noninstitutionalized population in labor force. All civilians 16 years old and over are classified as unemployed if they (1) were neither “at work” nor “with a job but not at work” during the reference week, and (2) were actively looking for work during the last 4 weeks, and (3) were available to accept a job. Also included as unemployed are civilians who did not work at all during the reference week, were waiting to be called back to a job from which they had been laid off, and were available for work except for temporary illness.
- Household income is the sum of the income of all people 15 years and older living in the household. A household includes related family members and all the unrelated people, if any. A person living alone in a housing unit, or a group of unrelated people sharing a housing unit, is also counted as a household. Sources: American Community Survey (ACS) 2012-2016, 5-Year Public Use Microdata Sample (PUMS). Households with missing income are excluded. A household includes related family members and all the unrelated people, if any. A person living alone in a housing unit, or a group of unrelated people sharing a housing unit, is also counted as a household.
- Household income is the sum of the income of all people 15 years and older living in the household. A household includes related family members and unrelated people, if any. A person living alone in a housing unit, or a group of unrelated people sharing a housing unit, is also counted as a household. Sources: American Community Survey (ACS) 2012-2016, 5-Year Public Use Microdata Sample (PUMS). Households with missing income are excluded. A household includes related family members and all the unrelated people, if any. A person living alone in a housing unit, or a group of unrelated people sharing a housing unit, is also counted as a household.
- People (25+) with college and above degree which includes Bachelor’s degree, Master’s degree, Professional degree beyond a bachelor’s degree, and Doctorate degree. Sources: American Community Survey (ACS) 2012-2016, 5-Year Public Use Microdata Sample (PUMS). Limited to age 25 and older population.
- People (25+) with college and above degree which includes Bachelor’s degree, Master’s degree, Professional degree beyond a bachelor’s degree, and Doctorate degree.Sources: American Community Survey (ACS) 2012-2016, 5-Year Public Use Microdata Sample (PUMS). Limited to age 25 and older population.